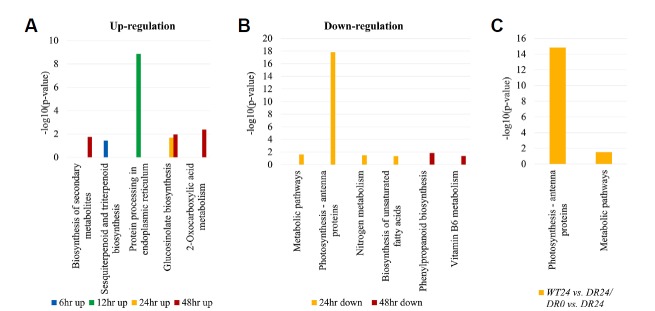
Fig. 4. KEGG ontology (KO) enrichment analysis of DEGs related to metabolism pathway.
All DEGs were enriched in different functional pathway categories with up-regulated DEGs (A) and down-regulated DEGs (B) in all pairwise comparison of WT and DR plants under drought stress. (C) 162 DEGs from combined analysis of DR_control (DR0) vs. DR and WT vs. DR were enriched in 2 KEGG pathway categories. p-value ≤ 0.05 and absolute log2 fold change ≥ 2 were used as thresholds to select significant KEGG pathways.

