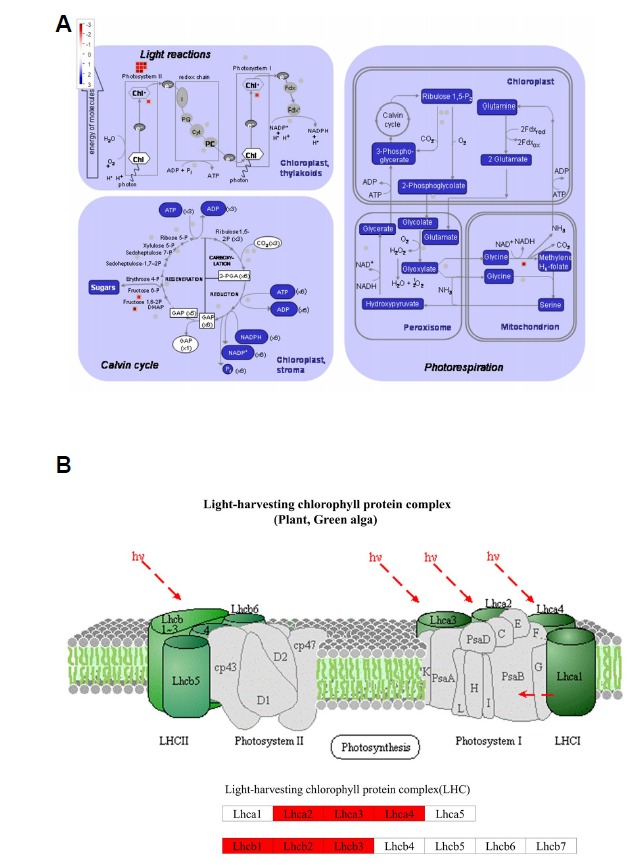
Fig. 5. MapMan analysis of photosynthesis and KEGG map of the photosynthesis-antenna protein between WT24 vs. DR24 and DR0 vs. DR6.

(A) Light reactions, Calvin cycle, and Photorespiration of Photosynthesis pathway in MapMan. Red boxes indicate down-regulation. (B) The pathway of photosynthesis-antenna protein in KEGG map. Red boxes indicate that the corresponding DEGs were down-regulated in DR24.
