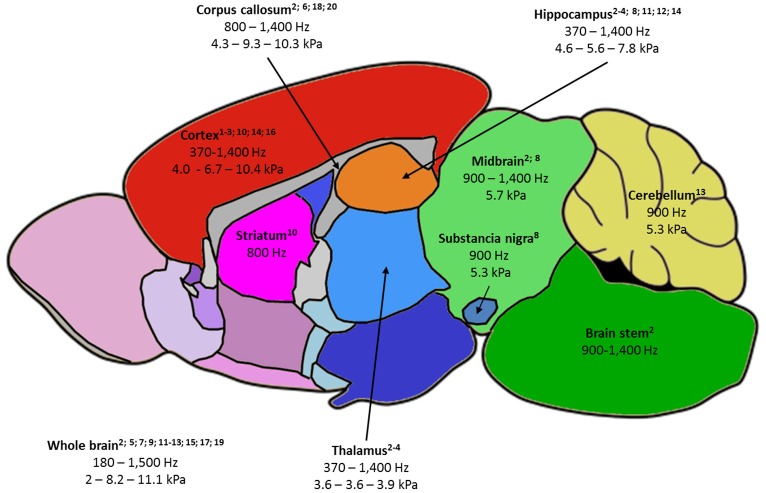
Figure 2.
Summary of the rodent brain areas studied by MRE, labeled as follows: -(first line) name of brain area, with relevant publications listed below;
-(second line) frequency ranges used to probe the area;
-(third line) when available, the minimum value of |G*| - the average of |G*| values reported at 900 and 1,000 Hz – maximum reported |G*| value. |G*| was chosen as it is the most fequently reported parameter and 900-1,000 Hz studies the most frequent in the literature.
1—Atay 2008; 2—Bertalan 2017; 3—Boulet 2011; 4—Châtelin 2016; 5—Clayton 2012; 6—Diguet 2009; 7—Freimann 2013; 8—Hain 2016; 9—Jamin 2015; 10—Jugé 2016; 11—Klein 2014; 12—Majumdar 2017; 13—Millward 2015; 14—Munder 2017; 15—Murphy 2012; 16—Patz 2017; 17 – Salameh 2011; 18—Schregel 2012; 19—Vappou 2008; 20—Yin 2017.

