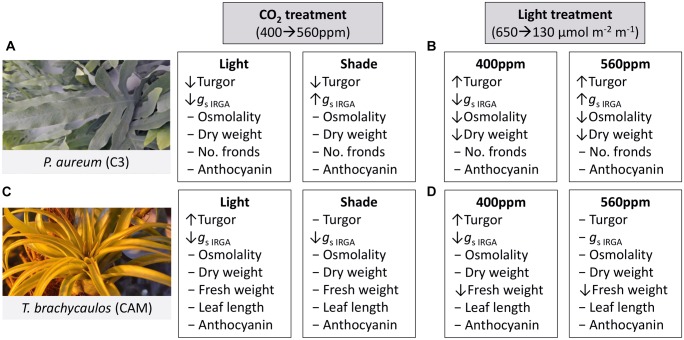
FIGURE 5.
Summary of treatment effects on P. aureum and T. brachycaulos comparing the two CO2 and light treatments. Symbols [decrease (↓), increase (↑), no change (-)] in front of the variable names indicate the direction of response when compared at α < 0.05. (A) Describes the treatment effect of CO2 from 400 to 560 ppm (gray box) in the light (white box) and shade treatment for P. aureum. (B) Describes the treatment effect of light from 650 to 130 μmol m-2 m-1 (gray box) in the 400 ppm (white box) and 560 ppm treatment for P. aureum. (C) Describes the treatment effect of CO2 from 400 to 560 ppm (gray box) in the light (white box) and shade treatment for T. brachycaulos. (D) Describes the treatment effect of light from 650 to 130 μmol m-2 m-1 (gray box) in the 400 ppm (white box) and 560 ppm treatment for T. brachycaulos.

