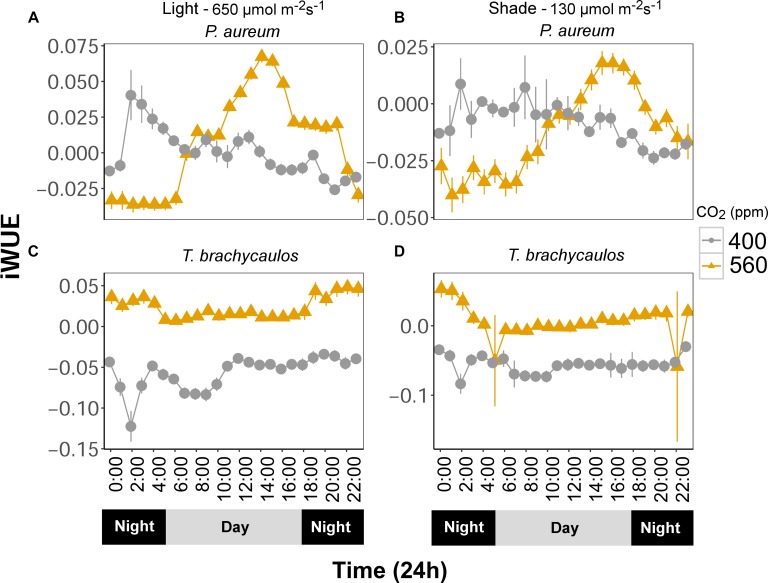
FIGURE 8.
(A,C) Represents P. aureum and T. brachycaulos grown under high light and (B,D) represents P. aureum and T. brachycaulos grown under low light. Mean values with 95% confidence intervals of intrinsic water use efficiency (A/gs = iWUE) measured for P. auruem and T. brachycaulos grown under experimental CO2 (gray circles = 400 ppm and yellow triangles = 560 ppm) and light (650 and 130 μmol m-2s-1) conditions.

