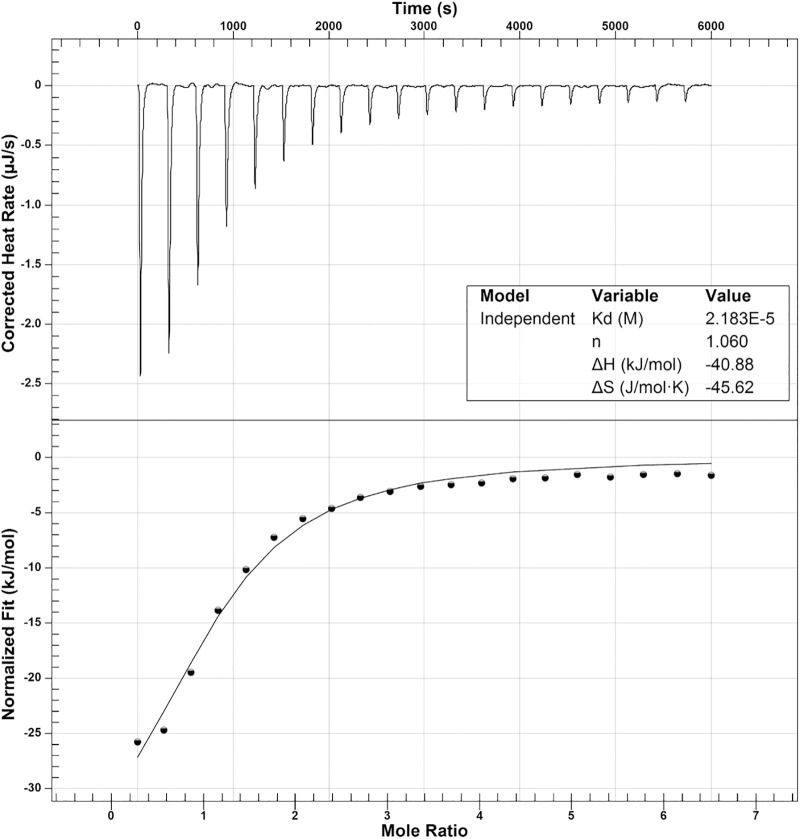
FIGURE 8.
Isothermal titration calorimetry analysis of OatA binding to acetyl-CoA. ITC was used to determine binding of AcCoA to OatA. Top panel is the raw data of heat release from 20 consecutive 2.48 μL injections of AcCoA (1 mM) into a 170-μL cell containing OatA (50 μM). Bottom panel represents binding isotherms obtained by integrating the areas under the curve of each injection peak. Data were acquired using a NanoITC (TA Instruments) and data were analyzed using NanoAnalyze 1.2 software. Molar ratio of AcCoA to OatA was 1:1 (represented by n) and dissociation constant (Kd) was found to be 2.18 × 10⁻⁵ M.

