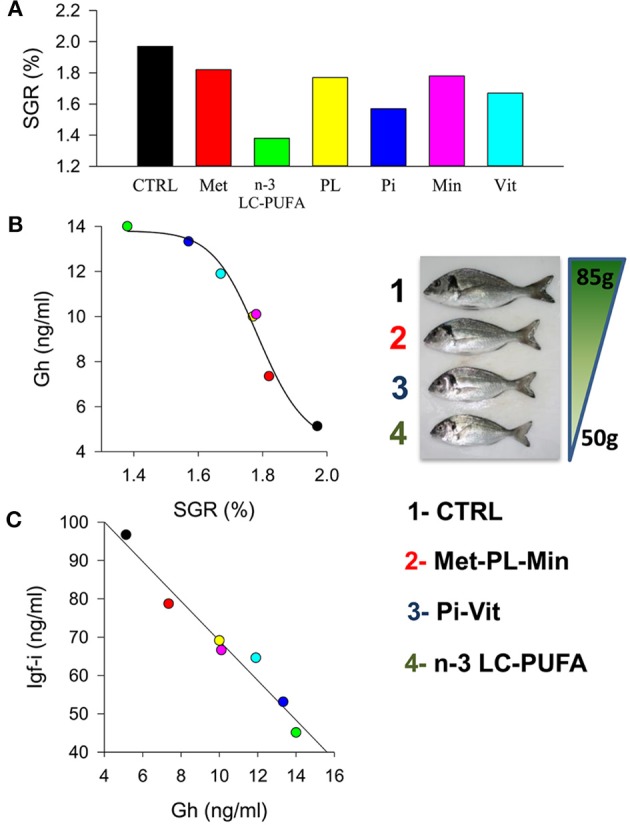
Figure 5.

(A) Effect of nutrient deficiencies on the specific growth rates (SGR) in juveniles of gilthead sea bream fed to visual satiety for 13 weeks from May to July. (B) Curvilinear correlation between SGR and plasma Gh levels. Insert image shows fish size differences at the end of trial. (C) Correlation between plasma Gh and Igf-i levels. Colors indicate each experimental group: CTRL, control (black); Met, methionine (red); n-3 LC-PUFA, n-3 long-chain polyunsaturated fatty acids (green); PL, phospholipids (yellow); Pi, phosphorus (blue); Min, minerals (pink); Vit, vitamins (cyan). Adapted from Ballester-Lozano et al. (152).
