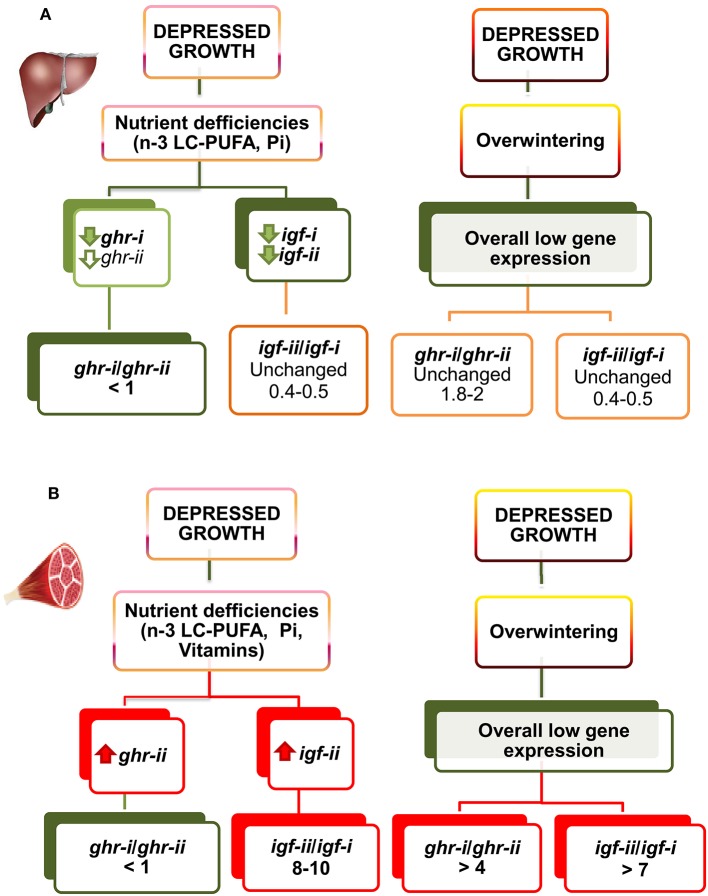
Figure 6.
Regulated gene expression of igfs and ghrs by diet composition and season in liver (A) and skeletal muscle (B) of gilthead sea bream juveniles. The direction of change is represented by color (red, increase; green, decrease; orange, unchanged). For full details of gene expression profiling see Tables S1–S6. Adapted from Benedito-Palos et al. (146, 160) and Ballester-Lozano et al. (152).

