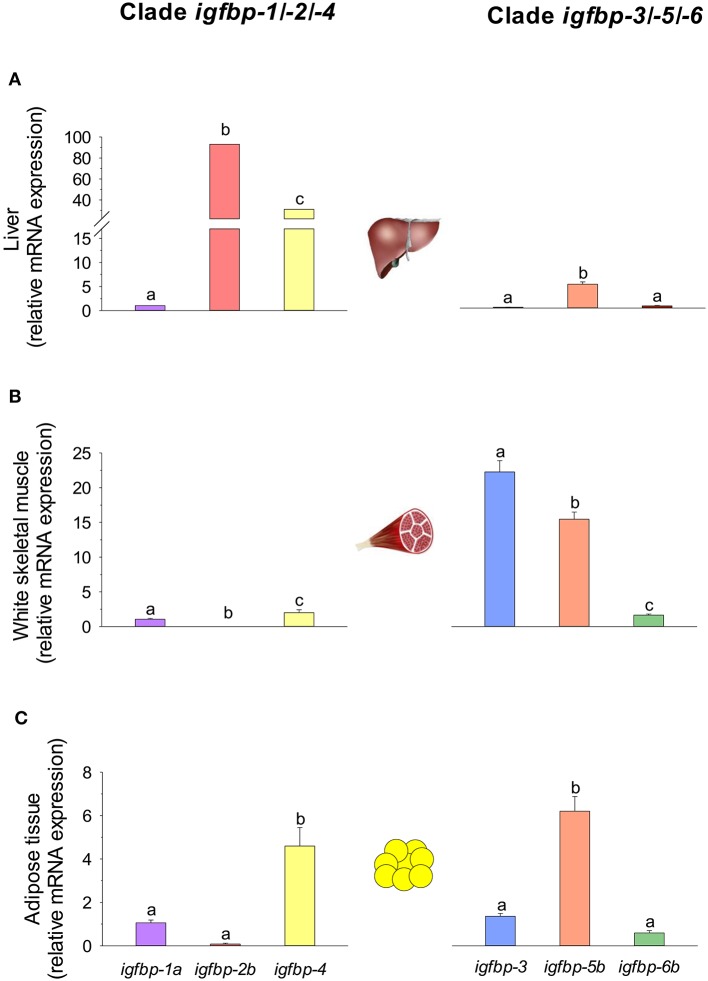
Figure 9.
igfbp gene expression profile in (A) liver, (B) white skeletal muscle, and (C) adipose tissue of juveniles of gilthead sea bream. RT-qPCR of tissue total RNA was conducted as previously reported (134). Analyzed genes of clade igfbp-1/-2/-4 were igfbp-1a, igfbp-2b, and igfbp-4. For clade igfbp-3/-5/-6, primers for igfbp-3 detected both igfbp-3a and -3b paralogs, and expression levels of igfbp-5b and igfbp-6b were analyzed. For each tissue, data values (mean ± SEM, n = 8–9) are normalized to the expression level of igfbp-1a (arbitrary value of 1). In each tissue and clade, different superscript letters indicate significant differences (P < 0.05; ANOVA followed by Student-Newman–Keuls test).

