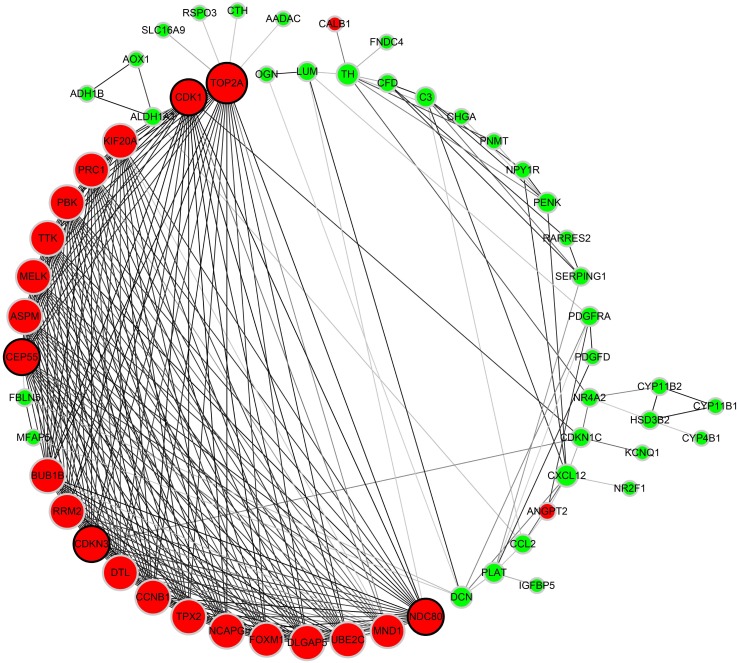
Figure 4.
Protein-protein interaction network of 87 DEGs (using STRING). Network nodes stand for proteins (represented with gene names). The color in each node corresponds to the expression of DEGs in comparison to normal adrenal gland samples (red for up-regulation and green for down-regulation). The size of each node and the color intensity in every edge represent the degree of interconnection between network nodes.

