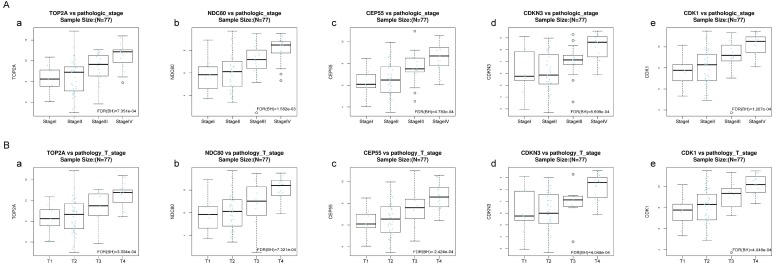
Figure 8.
Validation of the correlation between the expression levels of five hub genes with the pathologic stage and the pathologic T stage of ACC (based on TCGA data in LinkedOmics). The red line indicates the samples of genes of high expression and the blue line represents for the samples of genes of low expression. FDR (BH) - false discovery rate is calculated by Benjamin-Hochberg (BH) method. (A) Pathology stage. (a) TOP2A, (b) NDC80, (c) CEP55, (d) CDKN3, and (e) CDK1. (B) Pathology T stage. (a) TOP2A, (b) NDC80, (c) CEP55, (d) CDKN3, and (e) CDK1.

