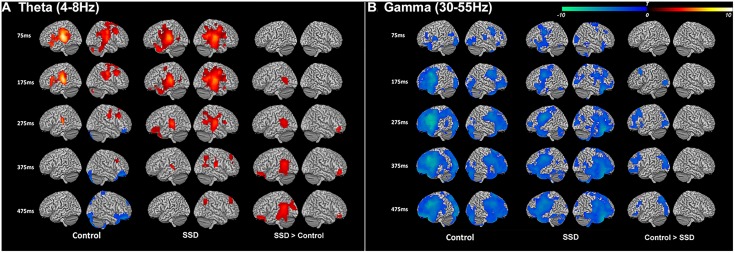
FIGURE 2.
Induced theta band (4–8 Hz) and gamma band (30–50 Hz) neural oscillations during syllable encoding in normal hearing control and single-sided deafness (SSD) cohorts, and differences between the two cohorts. (A) Theta and (B) gamma band oscillations show similar recruitment of cortical regions in the two cohorts (left and middle columns). For within group contrasts, warm colors indicate increased magnitude relative to a pre-stimulus baseline in the theta band and cool colors indicate increased magnitude relative to a pre-stimulus baseline in the gamma band. (A) SSD cohort has increased recruitment (right column) of higher order auditory cortex in the theta band. (B) SSD cohort has decreased recruitment attention and working memory networks (frontal, parietal, and occipital cortical regions) in the gamma band. In SSD and control cohort contrasts, warm colors in the theta band indicate regions where activity is increased in SSD and cool colors in the gamma band indicate regions where activity is decreased in SSD. ms, milliseconds.

