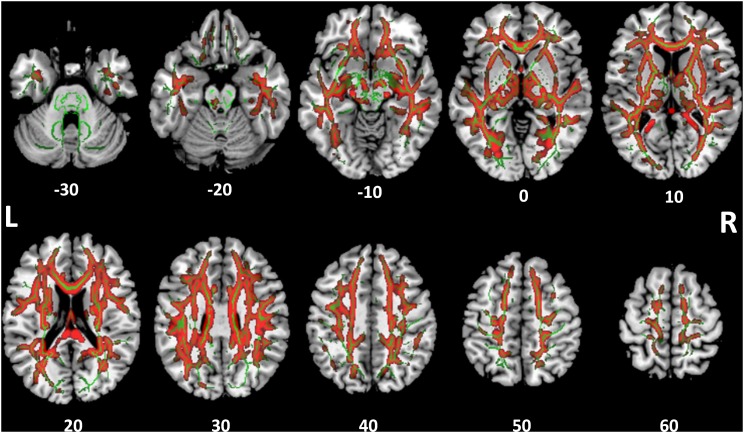
FIGURE 4.
Tract-based spatial statistics for medial diffusivity (MD). Widespread tracts with increased MD in SSD patients compared to control subjects (red) are superimposed on the skeleton (green) of tracts common to both cohorts. The z coordinate in the MNI space for each axial section is noted at bottom.

