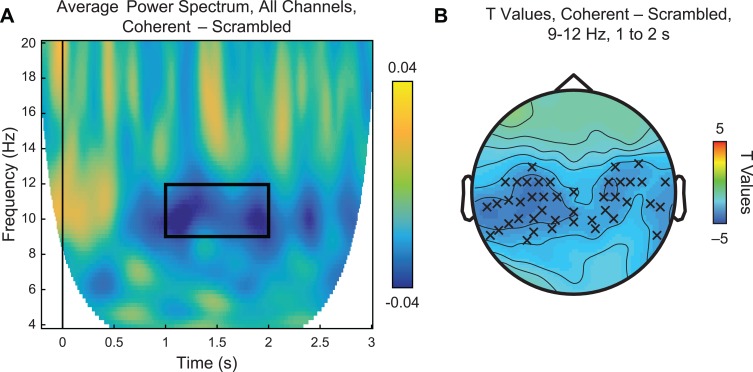
Fig. 3.
Main effect of action coherency. (A) Time-frequency plot of average power spectrum from 4 to 20 Hz for coherent–scrambled PLDs across all 128 channels. In the time window between 1 and 2 s, we observed reduced power within the alpha band of 9–12 Hz (black box). (B) Statistical analysis of the highlighted time and frequency window using a paired samples t-test revealed significant suppression (P < 0.05, permutation-corrected for multiple comparisons) in centroparietal and temporal sensors, as indicated by Xs.

