Fig. 4.
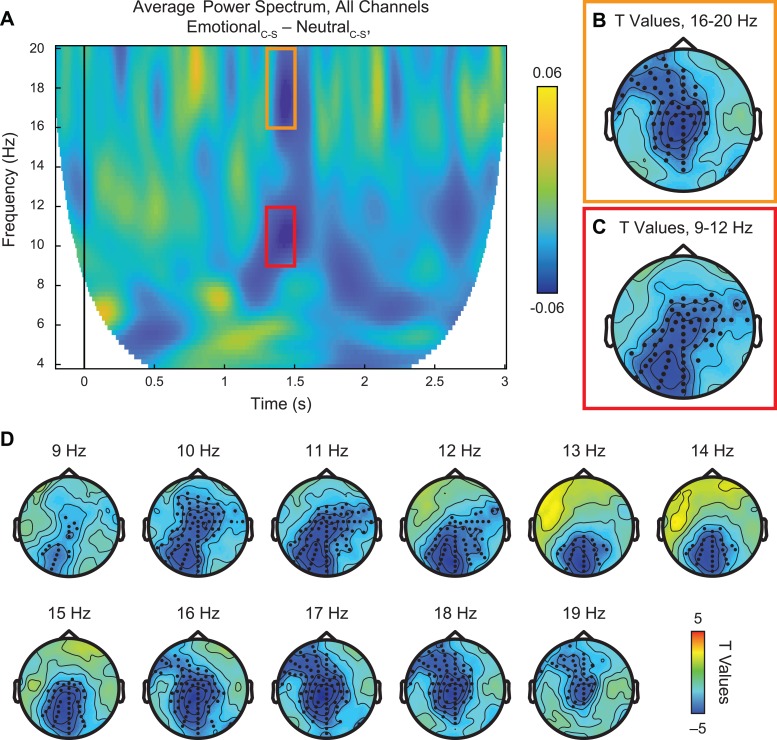
Neural response to emotional vs neutral PLDs, controlling for low-level visual properties. (A) Time-frequency plot of average power spectrum from 4 to 20 Hz across all 128 channels for the double subtraction of (EmotionalCoherent – EmotionalScrambled) – (NeutralCoherent – NeutralScrambled). Within the time window of ∼1.3–1.5 s after stimulus onset, we identified two major suppression effects in the alpha (9–12 Hz, red box) and central beta (16–20 Hz, orange box) frequency bands. (B–C) Statistical analysis using paired samples t-test revealed significant suppression effects (P < 0.01, permutation-corrected) in the beta (B) and alpha (C) frequency bands at frontocentral and centroparietal/occipital sites, respectively, as indicated by black dots. (D) Scalp plots of significant t values across all frequencies from 4 to 20 Hz, 1.3 to 1.5 s after stimulus onset. This less constrained statistical test across all frequencies found major effects between 9 and 20 Hz, in line with the targeted results from alpha and beta bands.

