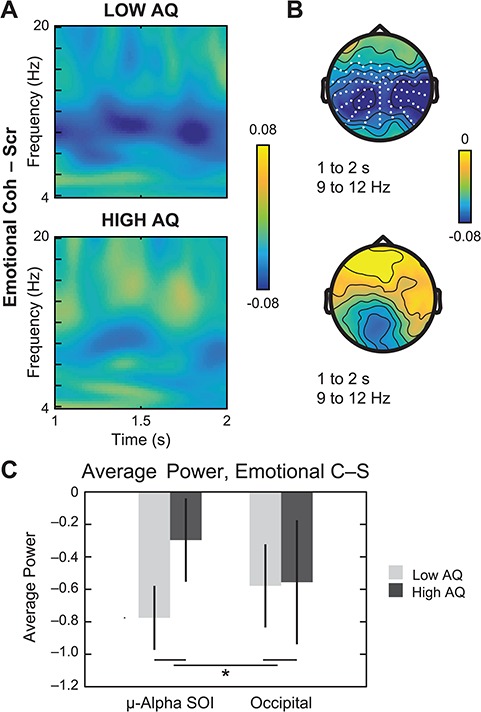
Fig. 6.

Neural response to emotional PLDs median-split by AQ. (A) Simple comparison of EmotionalCoherent – EmotionalScrambled in participants with population-typical scores (‘Low AQ’, top) vs autistic tendencies (‘High AQ’, bottom). Across the time window from 1 to 2 s, suppression effects in the alpha band (9 to 12 Hz) are more pronounced in the low-AQ subgroup. (B) Paired samples t-tests in the 9–12 Hz frequency range for the low-AQ group (top) revealed significant suppression effects across central, temporal and parietal sites (white dots, permutation-corrected P < 0.005), whereas suppression over occipital sensors was not significant in the high-AQ subgroup (bottom). (C) Direct comparison of average power from 9 to 12 Hz and 1 to 2 s at sensors associated with the main effect of coherent–scrambled (‘μ-Alpha SOI’) vs occipital sites for low vs high AQ. Error bars indicate standard error of the mean.
