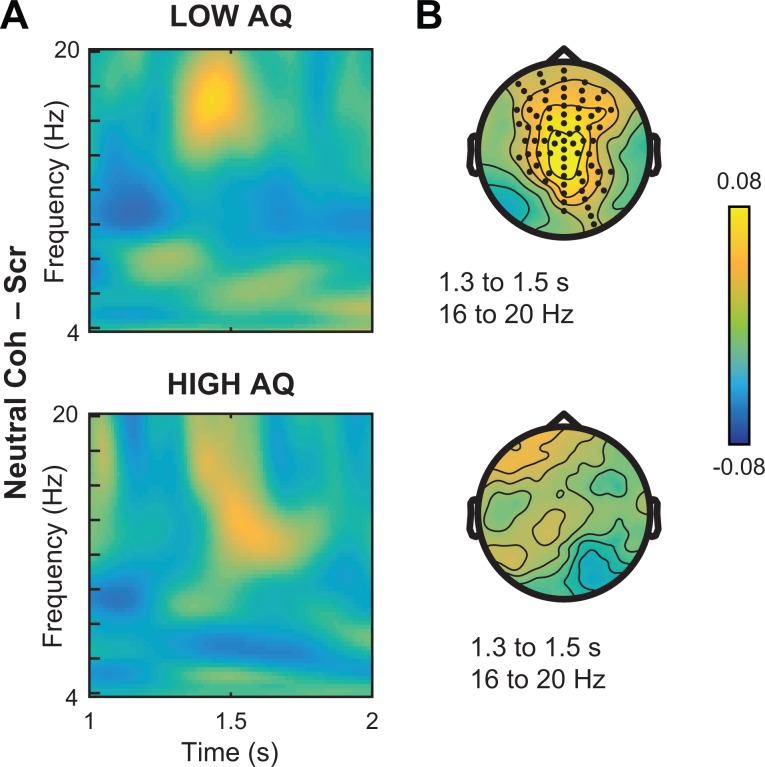
Fig. 7.
Neural response to neutral PLDs median-split by AQ. (A) Simple comparison of NeutralCoherent – NeutralScrambled in participants with population-typical scores (‘Low AQ’, top) vs autistic tendencies (‘High AQ’, bottom). As in the group data, we observed beta enhancement between ∼1.3 and 1.5 s after stimulus onset, with a stronger effect in the low-AQ subgroup. (B) Paired samples t-tests in the 16–20 Hz frequency range for the low-AQ group (top) found significant effects in frontocentral sensors (black dots, permutation-corrected P < 0.001). In contrast, no significant effects for this time or frequency range were observed for the high-AQ subgroup.

