
Fig. 1.
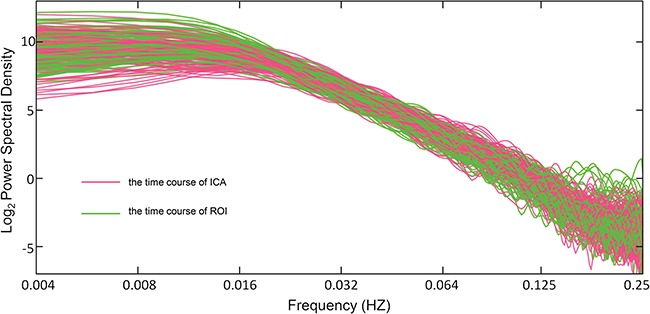
The power spectra of all subjects without band-pass filtering from the cumulative sum of the time courses of ICA (red) and region of interests (ROIs; green). The scale parameters were chosen to correspond to a frequency range of (0.016, 0.063) Hz.