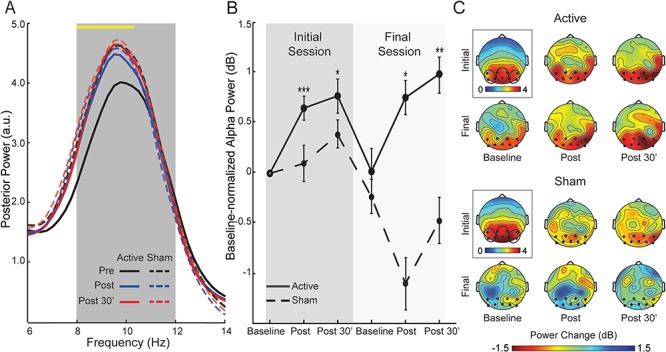
Fig. 2.

Changes in posterior alpha power. (A) Spectra of normalized power (collapsed across occipitoparietal electrodes) for each group at the three time points, averaged across the initial and final sessions. The yellow line at the top of the waveforms indicates frequency bins (0.25 Hz each) showing a significant Time-by-Group interaction. The interaction effect appeared selectively in the lower half of the targeted alpha range (8–10.5 Hz), confirming the specific modulation of alpha power. Note, the Active group demonstrated post-stimulation increases in the alpha band from the baseline while the Sham group demonstrated equivalent alpha power before and after stimulation. (B) Alpha power magnitudes, decibel-normalized to the initial baseline, for each group. (C) Scalp topographical maps of normalized alpha power at the initial baseline (surrounded by a black box and associated with its own color scale) and decibel-normalized power changes at each assessment thereafter. Electrodes included in occipitoparietal sites are bolded and encircled. Error bars = SEM. *P < 0.05; **P < 0.01; ***P < 0.005. All P-values are relative to the initial baseline. Note that the groups did not differ in the initial baseline values (P > 0.19).
