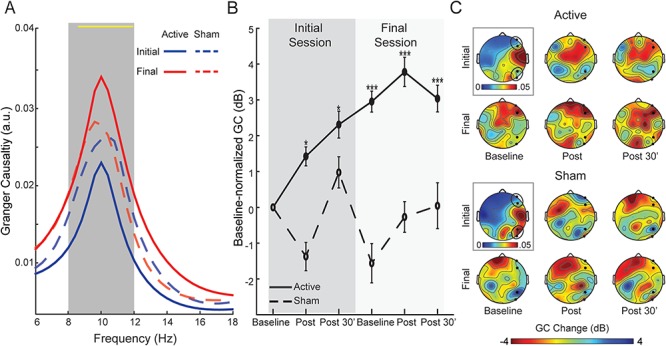
Fig. 3.

Changes in posterior ➔frontal GC. (A) Spectra of right-hemisphere posterior ➔frontal GC for each group (averaged across time for simplicity). The yellow line at the top of the waveforms indicates frequency bins (0.25 Hz each) showing a significant Session-by-Group interaction, which spans almost the entire alpha band (8.25–12 Hz) but no other frequency band, confirming the specific modulation of alpha-frequency GC. (B) Magnitudes of right posterior ➔frontal alpha GC, decibel-normalized to initial baseline, for each group. (C) Scalp topographical maps of alpha GC sent from right occipitoparietal electrodes at the initial baseline (surrounded by a black box and associated with its own color scale) and decibel-normalized changes at each assessment thereafter. Sending occipitoparietal and receiving frontal electrodes are bolded and encircled. Error bars = SEM. *P < 0.05; **P < 0.01; ***P < 0.005. All P-values are relative to the initial baseline. Note that the groups did not differ in the initial baseline values (P > 0.19).
