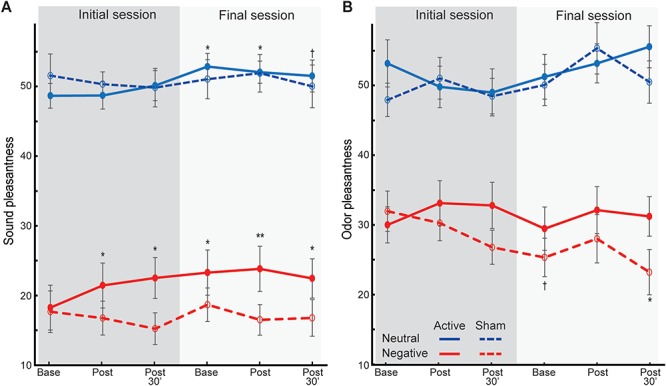
Fig. 5.

Pleasantness ratings of neutral and negative. (A) sounds and (B) odors. Neutral valence = 50. Error bars = SEM. *P < 0.05; **P < 0.01; †P < 0.1. All P-values are relative to the initial baseline. The groups did not differ in the initial baseline ratings (P > 0.215).
