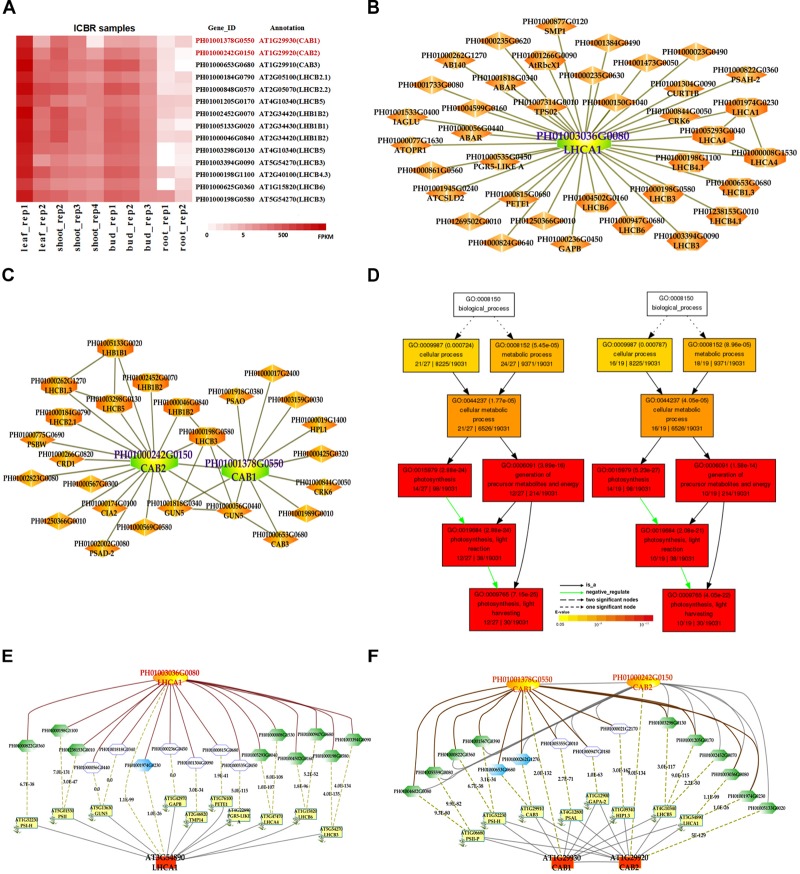
FIGURE 2.
The conditional co-expression network analysis of bamboo light-harvesting complex genes of photosystem I and photosystem II. (A) Heatmap of LHCB genes expressed in conditional leaf, shoot, bud, and root samples. (B) A conditional co-expression network of the gene LHCA1 (PH01003036G0080) in bamboo. The other LHCA genes are highlighted with orange borders, while nodes with yellow borders are LHCB genes. (C) A conditional co-expression network of CAB1 (PH01001378G0550, LHCB1.3) and CAB2 (PH01000242G0150, LHCB1.1). The other LHCB genes are also highlighted with orange borders. (D) GO enrichment analysis (left) of all genes from the conditional co-expression network for LHCA1 (PH01003036G0080) and GO enrichment analysis (right) of all genes from the conditional co-expression network for CAB1 (PH01001378G0550) and CAB2 (PH01000242G0150) by agriGO. (E) Comparison of conditional co-expression networks between LHCA1 in bamboo and AT3G54890 (LHCA1) in Arabidopsis. Dotted lines link orthologous pairs between the two species, and the numbers in the middle of the dotted lines are the E-values of the BLAST results. (F) Comparison of conditional co-expression networks between CAB1 and CAB2 in bamboo and AT1G29930 (CAB1) and AT1G29920 (CAB2) in Arabidopsis. Dotted lines link orthologous pairs between the two species, and the numbers in the middle of the dotted lines are the E-values of the BLAST results.

