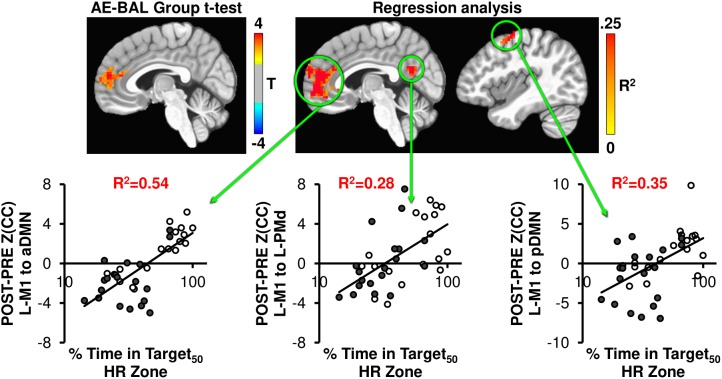
FIGURE 4.
The AE-BAL group t-test of Z(CC)DIFF seeded from L-M1 shows aDMN connectivity differences, indicating that the 12-week aerobic spin intervention was able to significantly L-M1 to aDMN connectivity in the AE group (p = 0.01, cluster size = 50). To further understand the relationship between individual subject response to the intervention, the % Time in Target HR Zone was correlated with Z(CC)DIFF seeded from L-M1 on a voxel-wise basis as described in Equation 4. The regression analysis also shows exercise induced changes in L-M1 to aDMN connectivity, along with L-M1 to pDMN, and L-M1 to L-PMd connectivity (p = 0.01, cluster size = 50). The plots show the average Z(CC)DIFF from the extracted ROI is predicted significantly by % Time in Target HR Zone. Closed circles = AE; Open circles = BAL.

