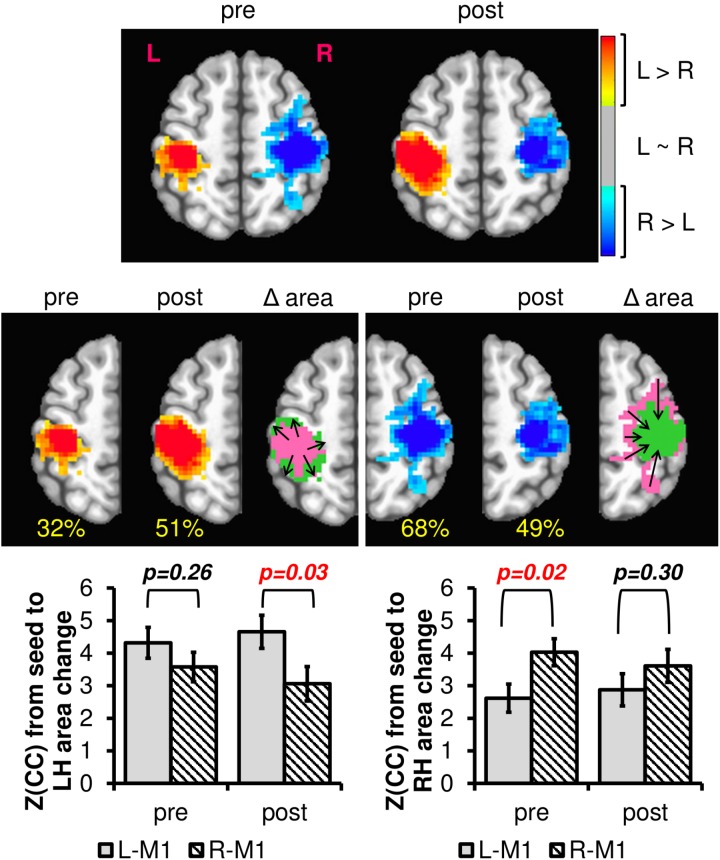
FIGURE 7.
The difference in left and right M1 connectivity (L-RM1), as calculated with Equation 4 PRE and POST 12-week exercise intervention. The hot colors represent areas where the left M1 is more connected than the right M1, and the cool colors represent the opposite. The blank areas contain voxels where left and right M1 have similar or no connectivity. The percentage values in yellow denote the proportion of voxels within one hemisphere compared to total of both hemispheres within each session. Notice that from pre to post, the left hemisphere L-RM1 area expands (from 32 to 51%), whereas the right hemisphere L-RM1 area contracts (68–49%). Plotting the average connectivity strength in the voxels with changing area, R-M1 connectivity to the left hemisphere is reduced after 12-weeks of exercise intervention while the L-M1 connectivity is maintained or slightly increased. L-M1 connectivity increases and R-M1 connectivity decreases in the voxels with changing areas. After a 12-week exercise intervention (AE or BAL), the group average M1 connectivity profile is balanced across hemispheres. Δarea pink = pre area, Δarea green = post area.

