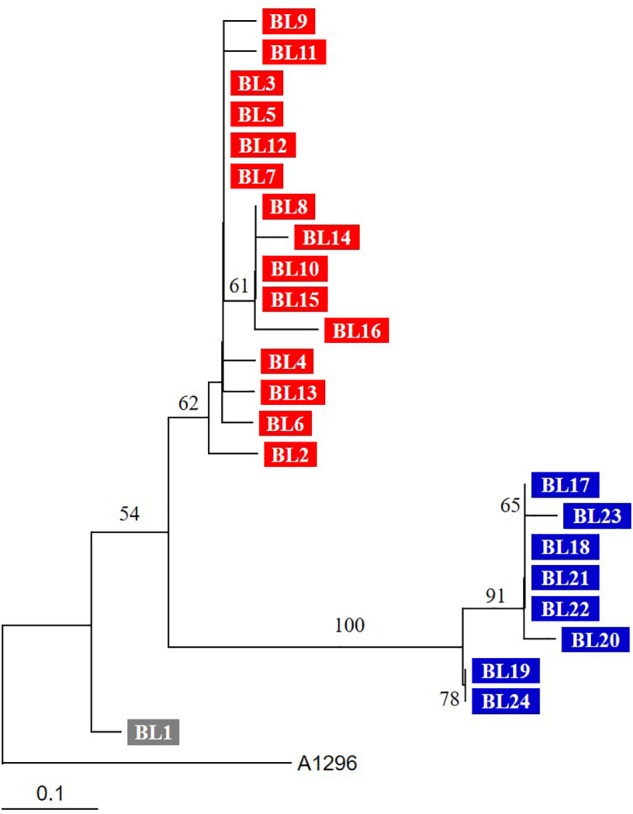
FIGURE 2.

Phylogenetic tree based on SNVs of genome sequences. The tree was constructed by the neighbor-joining method. Three groups (BL1, BL2–BL16, and BL17–BL24) are indicated by different colors. The tree was reconstructed by the neighbor-joining method (MEGA 5.10), and A. baumannii ST138 strain A1296 was used as an outgroup. Numbers on branching nodes are percentages of 1,000 bootstrap replications; only values ≥ 50% are shown. The scale bar represents one substitution per 10 SNVs.
