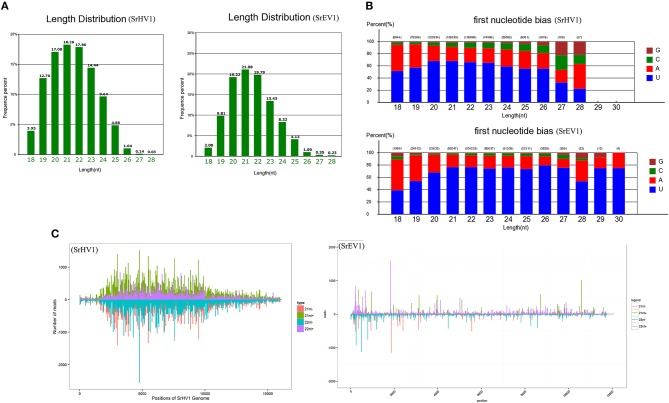
Figure 6.
SrHV1 and SrEV1 derived small RNAs analysis. (A) Size distribution and abundance of small RNAs matching the SrHV1 and SrEV1 genomes. (B) 5′-terminal nucleotide composition among the SrHV1 and SrEV1-derived vsiRNAs. The x-axis represents the length distribution, and the y-axis shows the percentages of nucleotides constitute of G/C/A/U in the 5′-terminal of the vsiRNAs. (C) The vsiRNA profiles distribution among the SrHV1 and SrEV1. The vsiRNAs derived from the positive and negative strand of the viral genome were indicated above and below the line, respectively. For SrHV1, the 21-nt vsiRNAs arising from the genomic and antigenomic strands were shown in green and red bars, respectively. The 22-nt vsiRNAs matching the genomic and antigenomic strand were represented by purple and blue, respectively. For SrEV1, the 21-nt and 22-nt vsiRNAs arising from the genomic and antigenomic strands were indicated by green and purple bars, red and blue bars, respectively. The x-axis indicated the length of the SrHV1 and SrEV1 genomes, respectively. While the y-axis in SrHV1 and SrEV1 separately represented numbers of reads matching to the genomic and antigenomic sequences of the two viruses.

