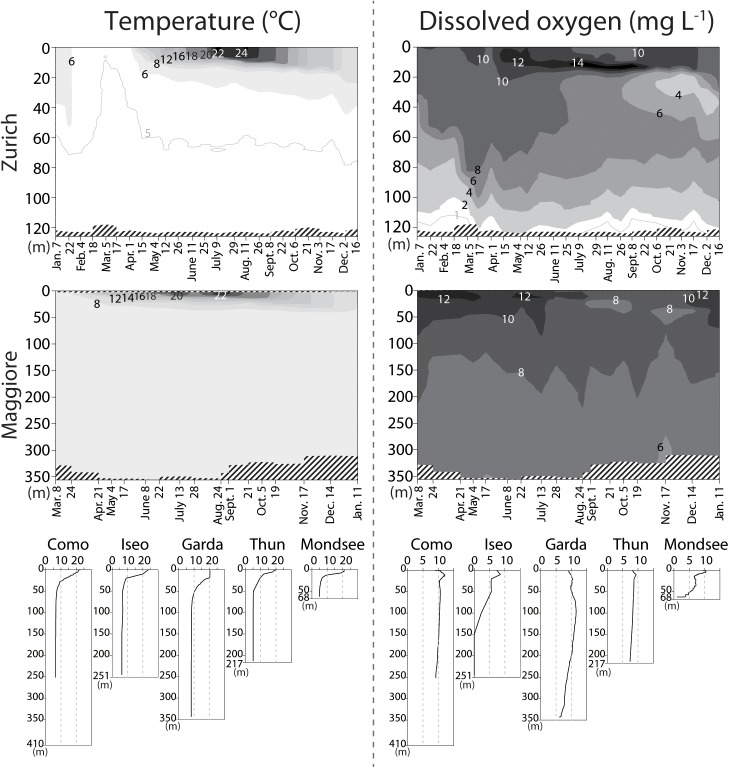
FIGURE 1.
Profiles of the temperature (left panels; °C) and dissolved oxygen (right panels; mg L-1) measured in situ. The vertical axes indicate water depth. For Lake Zurich and Maggiore, the sampling dates are indicated in the horizontal axes, and spatio-temporal measurements are shown by contours. Shaded areas indicate missing measurements.

