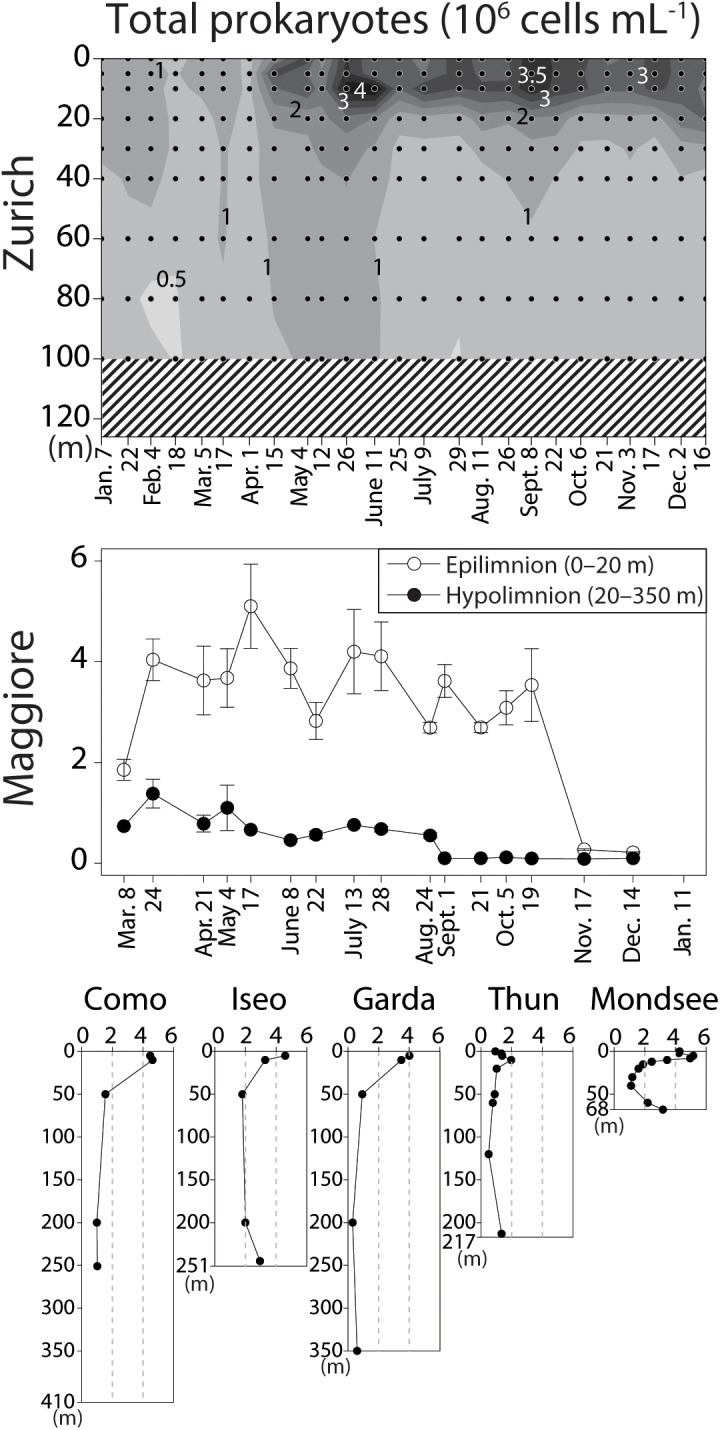
FIGURE 2.

Total prokaryotic abundance determined by enumeration of DAPI-stained cells (106 cells mL-1). The vertical axes indicate water depth. For Lake Zurich, spatio-temporal measurement is shown by contours. Dots indicate sampling depths and dates, shaded areas missing measurements. The data for Lake Maggiore were measured in an integrated sample for epilimnetic (0–20 m) and hypolimnetic (20–350 m) water (see main text for detail). Error bars indicate standard error.
