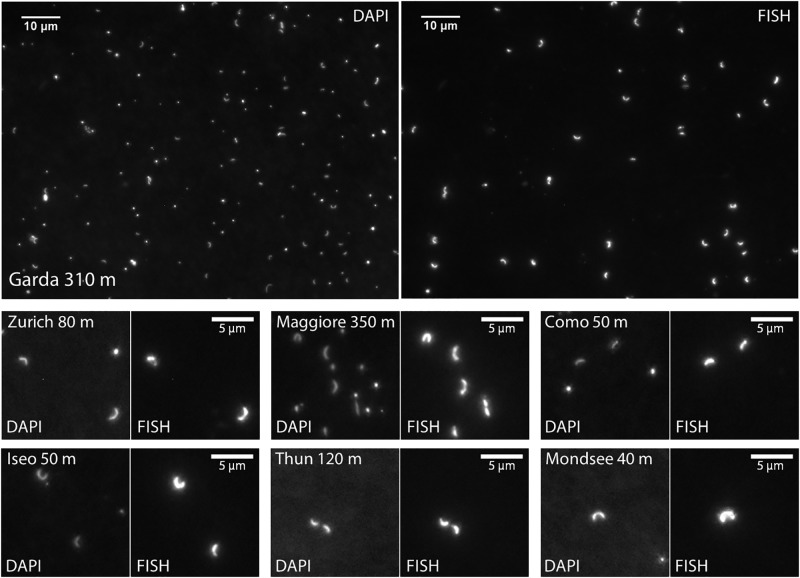
FIGURE 3.
Microscopic images of CL500-11 cells detected by CARD-FISH. In each panel, DAPI-stained cells and the corresponding FISH-positives were shown in the left and right side, respectively. A whole microscopic field was shown for the sample taken from 310 m in Lake Garda, where the highest proportion of CL500-11 cells was recorded. For the other lakes, enlarged images were shown. The samples taken on December were used for the images from Lake Zurich and Maggiore.

