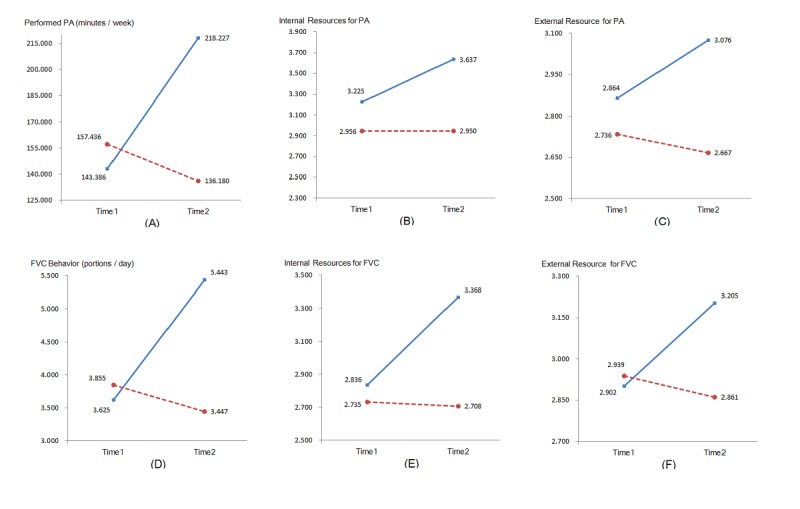
Figure 2.

Mean values for intervention group (solid line) and waiting control group (dotted line) at T1 and T2. (A) Performed physical activity (PA) (minutes/week). (B) Internal resources for PA (combination of intention, self-efficacy, and planning). (C) External resources for PA (social-support). (D) Fruit and vegetable consumption (FVC) behaviour (portions/day). (E) Internal resources for FVC (combination of intention, self-efficacy, and planning). (F) External resources for FVC (social-support).
