Figure 3.

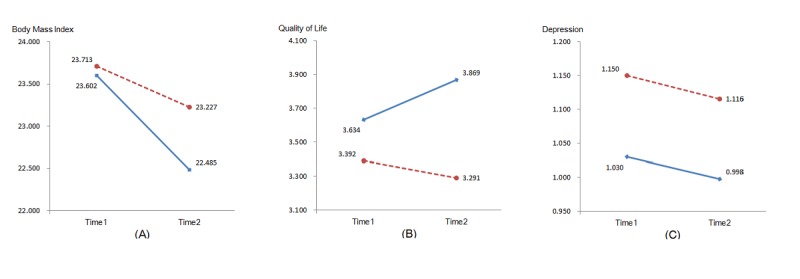
Mean values of health outcomes (Body mass index, quality of life, and depression) for intervention group (solid line) and waiting control group (dotted line) at T1 and T2. (A) Body mass index. (B) Quality of life. (C) Depression.

Mean values of health outcomes (Body mass index, quality of life, and depression) for intervention group (solid line) and waiting control group (dotted line) at T1 and T2. (A) Body mass index. (B) Quality of life. (C) Depression.