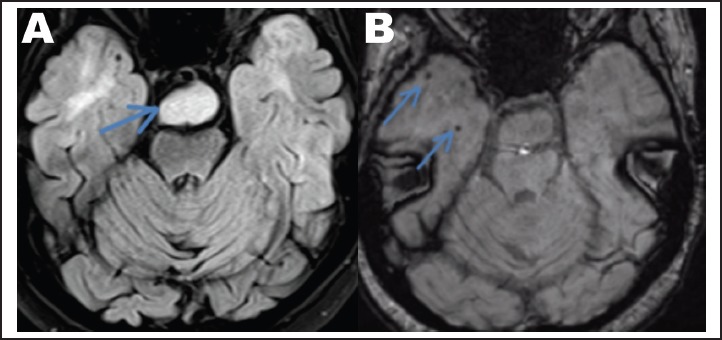
Figure 4.

(A) Axial T2 FLAIR demonstrates abnormal T2 hyperintensity within the anterior temporal lobes. The hypothalamic hamartoma is visible within the prepontine cistern (arrow). (B) Axial susceptibility weighted imaging demonstrates foci of susceptibility consistent with hemosiderin (arrows).
