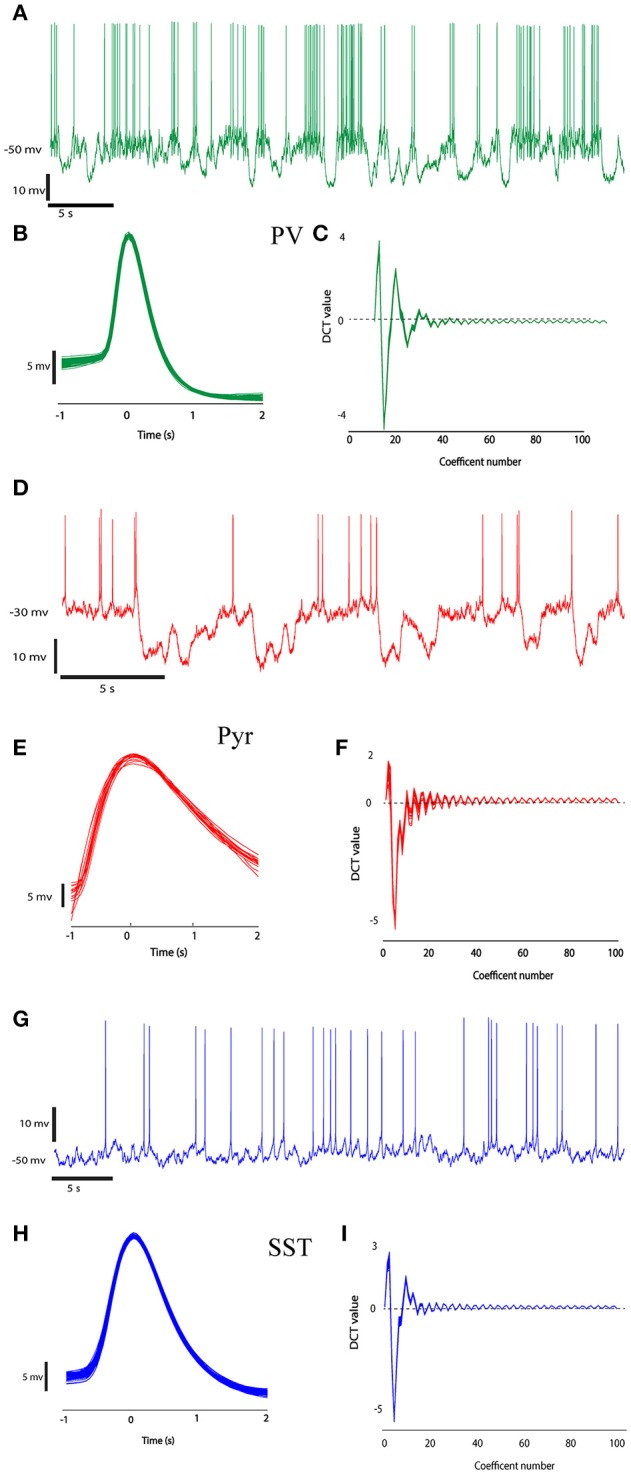
Figure 2.

The recorded data from three different neuron types (PV, Pyr, and SST). Recorded raw data (A,D,G) and the ensemble of spikes extracted from the raw data by windowing over the spikes' peaks at second column (B,E,H, 1 ms before peak to 2 ms after each spike peak). (C,F,I) shows DCT coefficients extracted from their spikes waveform.
