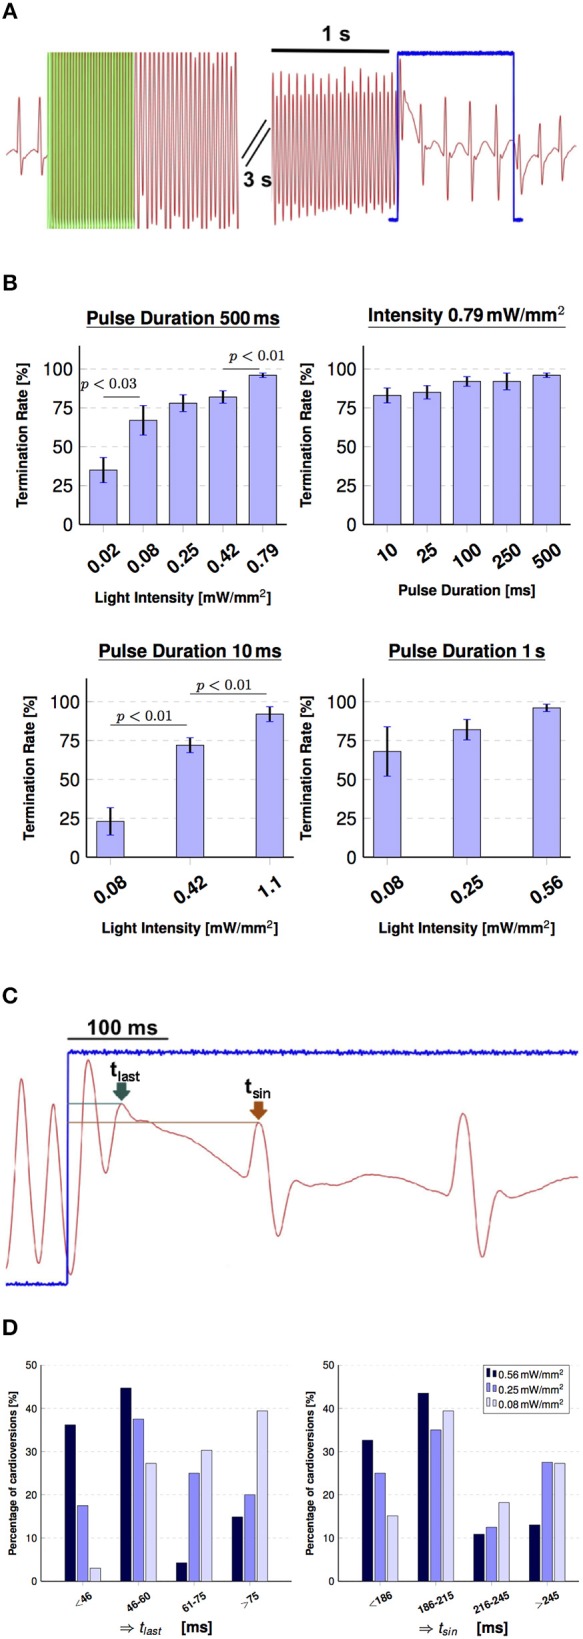
Figure 4.

Global illumination for cardioversion. (A) Shows the pseudoECG signal during arrhythmia evocation via electrical pacing and termination using global illumination (green overlay indicates electrical pacing at 50 Hz, 30 pulse). The arrhythmic conditions were terminated with a 1 s stimulation pulse (indicated in blue), during which the normal sinus rhythm already returned. (B) Summary of the influence of intensity and pulse duration on cardioversion attempts. Successful optogenetic defibrillation rates (percentage of successful attempts reported as mean ± SEM, N = 6). (C) Visualizes the effect of the termination pulse shown in (A) in more detail. Two time points were defined in order to characterize the moment of arrhythmia termination for the 1 s pulses: tlast (green arrow), which denotes the last peak of the arrhythmia and tsin (brown arrow), which denotes the first peak of the sinus rhythm during optogenetic stimulation. (D) Charts indicating the effect of intensity on cardioversion times in percentage of arrhythmia terminated in those periods of tlast (left) and tsin (right) for 0.56 mW mm-2 (N = 47), 0.25 mW mm-2 (N = 40), 0.08 mW mm-2 (N = 33).
