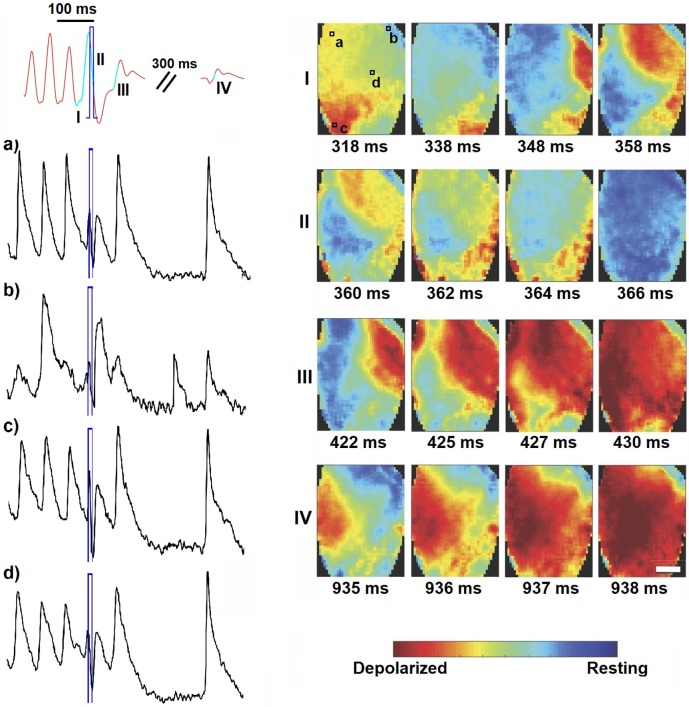
Figure 5.
Wave dynamics during short global light pulse (10 ms, 0.25 mW mm-2, highlighted in blue). Shown are the MAP recording (in red) and optical traces of several local spots on the ventricles (in black, as indicated in panel I). Optical mapping analysis revealed vortex-like electrical activity on the heart surface (image sequence I), which is disturbed by global illumination (image sequence II) and thus provoking wave collision resulting in annihilation (image sequence III). Sinus activity follows after a peak corresponding to depolarization of the whole heart (image sequence IV). The corresponding movie is available as (Supplementary Material Movie 2).

