FIGURE 5.

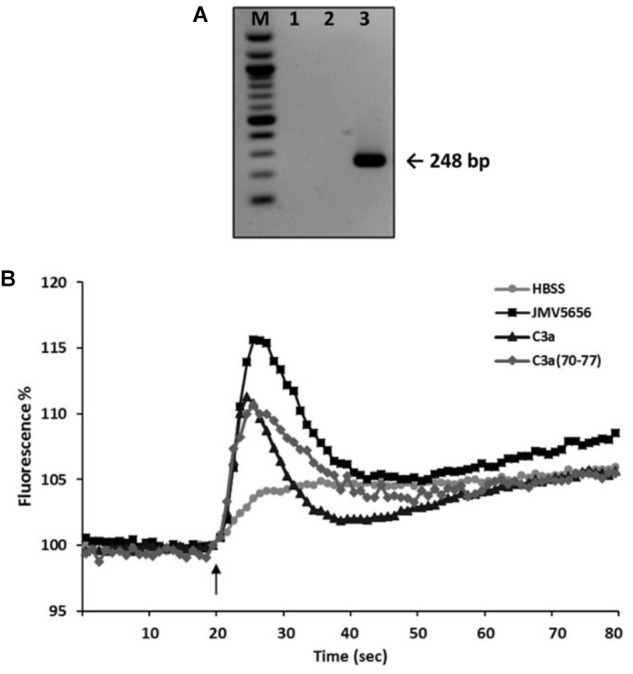
Effect of C3a and C3a(70-77) on intracellular Ca2+ levels in RAW264.7 cells. (A) Representative PCR amplification for C3aR in RAW264.7 cells. Lane M: molecular weight marker; lane 1: blank, no template control; lane 2: negative control (N-38 cells); lane 3: RAW264.7 cells. (B) Cells were loaded with FLUO-4 NW and fluorescence emissions were measured at 485/535 nm every 0.5 s for the 20 s preceding and the 60 s following the injection of the stimuli. HBSS, JMV5656, C3a, and C3a(70-77) (1 μM) were injected at the time indicated by the arrow. Results are the means of measurements obtained in at least six different wells for each experiments. All experiments were repeated at least three times. One representative experiment is shown.
