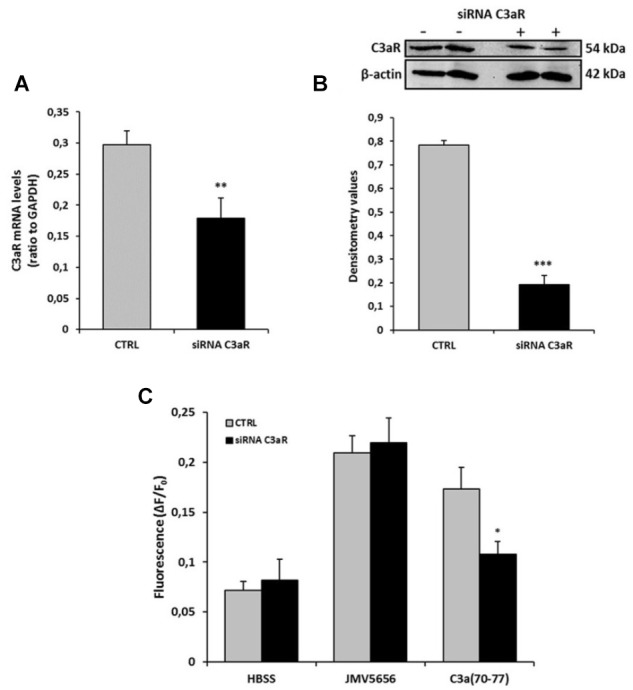
FIGURE 7.

Effect of C3aR siRNA on RAW264.7 cells stimulated with JMV5656 and C3a(70-77). Graphs show mRNA (A) and protein (B) levels of C3aR after transfection with 25 mM siRNA for 24 h. Data are shown as the mean ± SEM of measurements obtained in at least three independent experiments. ∗∗p < 0.01, ∗∗∗p < 0.001 vs. control (CTRL). (C) After 24 h from transfection with 25 mM siRNA, cells were loaded with FLUO-4 NW and fluorescence emissions were measured at 485/535 nm every 0.5 s for the 20 s preceding and the 60 s following the injection of the stimuli. Graphs show intracellular Ca2+ levels (expressed as fluorescence intensity) in RAW264.7 cells stimulated with HBSS (vehicle), JMV5656, and C3a(70-77) in the absence or presence of C3aR siRNA. Results are shown as the mean ± SEM of measurements obtained in three independent experiments (n = 18). ∗p < 0.05 vs. C3a CTRL (Student’s t-test).
