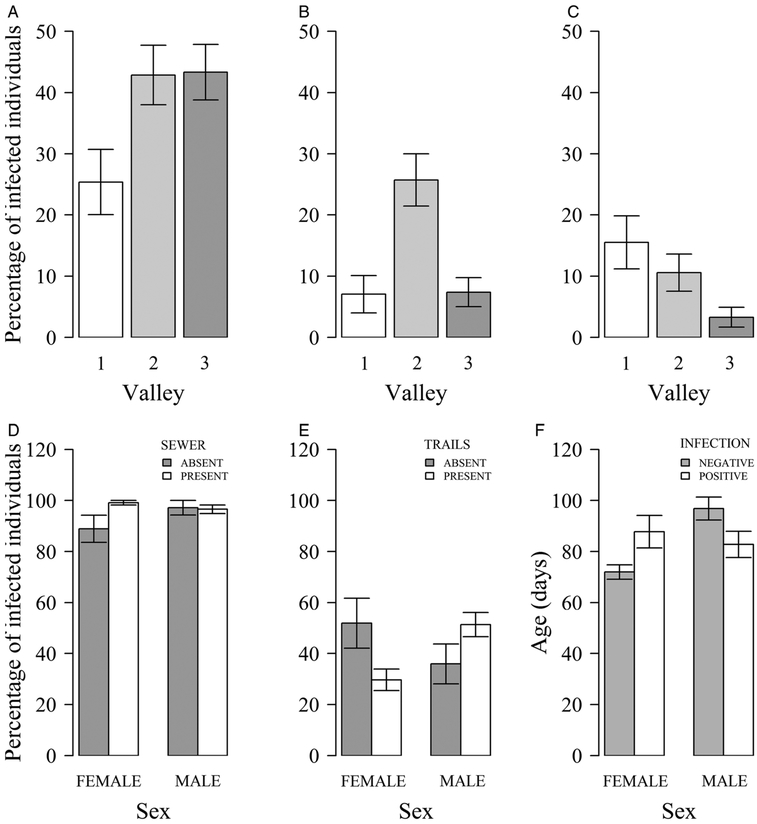
Fig. 2.
Mean percentages of infected rats (A–E). Infections by A. cantonensis (A), Hymenolepis spp. (B) and Trichuridae (C) per valley; by Strongyloides sp. (D) per sex and presence of sewer; by N. brasiliensis (E) per sex and presence of trails. F – Mean ages (days) of N. brasiliensis infected and not infected individuals by sex. Whiskers represent standard errors.

