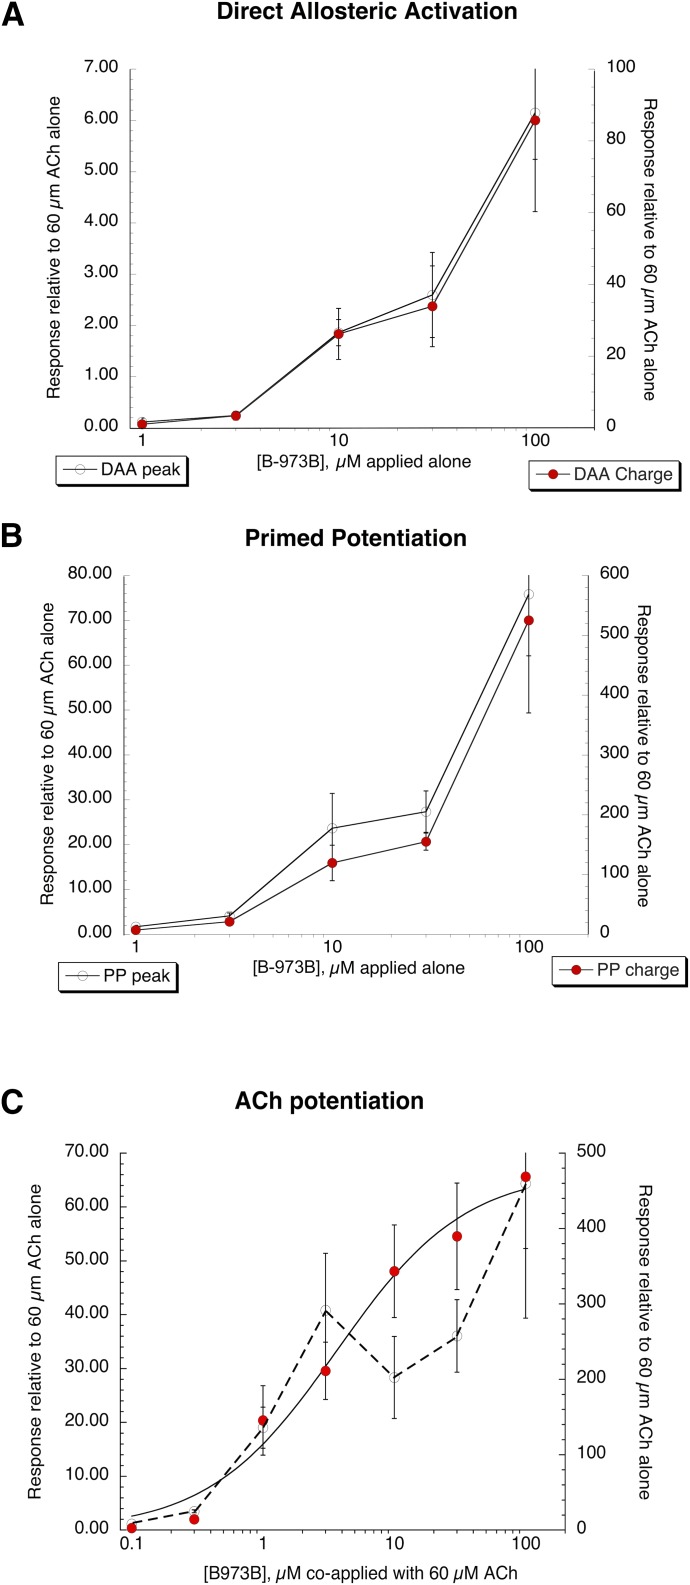
Fig. 2.
Concentration-response studies of B-973B. (A) DAA of human α7 nAChR expressed in oocytes. Data represent the average (±S.E.M.) responses, normalized to the average of two initial ACh controls of at least five cells at each concentration. Both the peak currents (left axis) and net charge (right axis) responses are shown. (B) Potentiated 60 µM ACh responses of human α7 nAChR expressed in oocytes after application of B-973B at the concentrations indicated (primed potentiation, see Fig. 1A). Data represent the average (±S.E.M.) responses, normalized to the average of two initial ACh controls of at least five cells at each concentration. Both the peak currents (left axis) and net charge (right axis) of the responses are shown. (C) Potentiated 60 µM ACh responses of human α7 nAChR expressed in oocytes during the coapplication of ACh and B-973B at the concentrations indicated. Data represent average (±S.E.M.) responses, normalized to the average of two initial ACh controls of at least five cells under each concentration. Plotted are both the peak currents (left axis) and net charge (right axis) of the responses. The peak current data were not appropriate to fit to the Hill equation. Peak currents, in general, have limited value as measurements of α7 nAChR function since they are confounded by the kinetics of solution exchange and the dynamics of receptor desensitization (Papke and Porter Papke, 2002). The net-charge data were fit to the Hill equation using the Levenberg-Marquardt algorithm with a Hill coefficient of 0.9 ± 0.2, IMax = 476 ± 40, n = 0.89 ± 0.18, and EC50 = 3.66 ± 1.15 µM.

