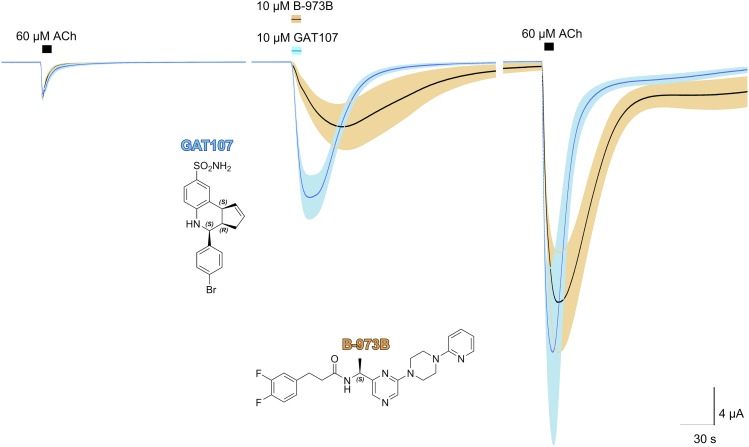
Fig. 3.
Macroscopic responses of α7 nAChR expressed in oocytes to 10 µM GAT107 (blue) or 10 µM B-973B (black and tan) compared. Shown are the averaged normalized responses (solid lines) of six cells (n ≥ 5) ± S.E.M. (tan area) to the ACh prior to and following application of either 10 µM GAT107 or 10 µM B-973B. Each trace of 10,322 points is 206.44 seconds long. Responses of individual cells were each normalized to their responses to 60 µM ACh before the ago-PAM applications. The vertical scale bar is calculated based on the average of the ACh control responses. The structures of the two ago-PAMs are also shown.

