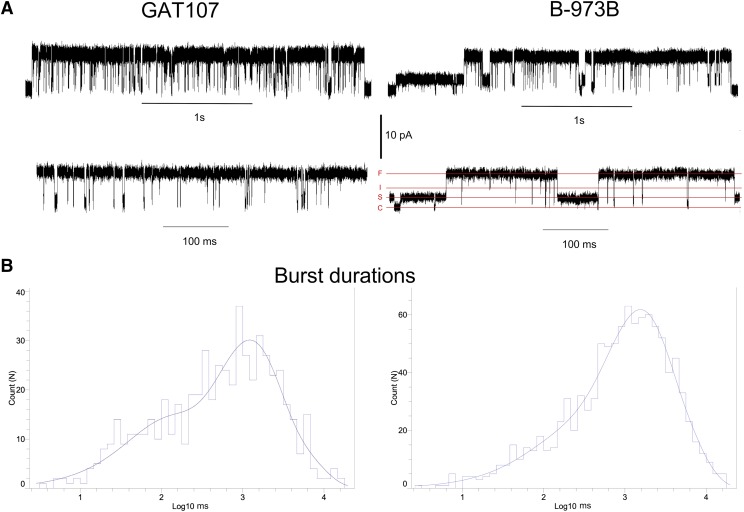
Fig. 6.
(A) Representative α7 single-channel traces of cell-attached patch recordings in 10 µM GAT107 or 10 µM B-973B, shown at different time scales as indicated. Currents were sampled at 50 kHz and low-pass filtered at 6 kHz. In the lower right trace, the various conductance levels are indicated: closed channels (C), small subconductance (S), intermediate subconductance (I), and full (large) open (F). (B) Normalized burst duration distributions for 584 bursts in GAT104 and 1047 in B-973B. Bursts were defined, and sequences of single-channel events were separated from other channel activity by a closed time of >50 milliseconds. The distributions were best fit by three exponential components. See Table 1 for the fit values.

