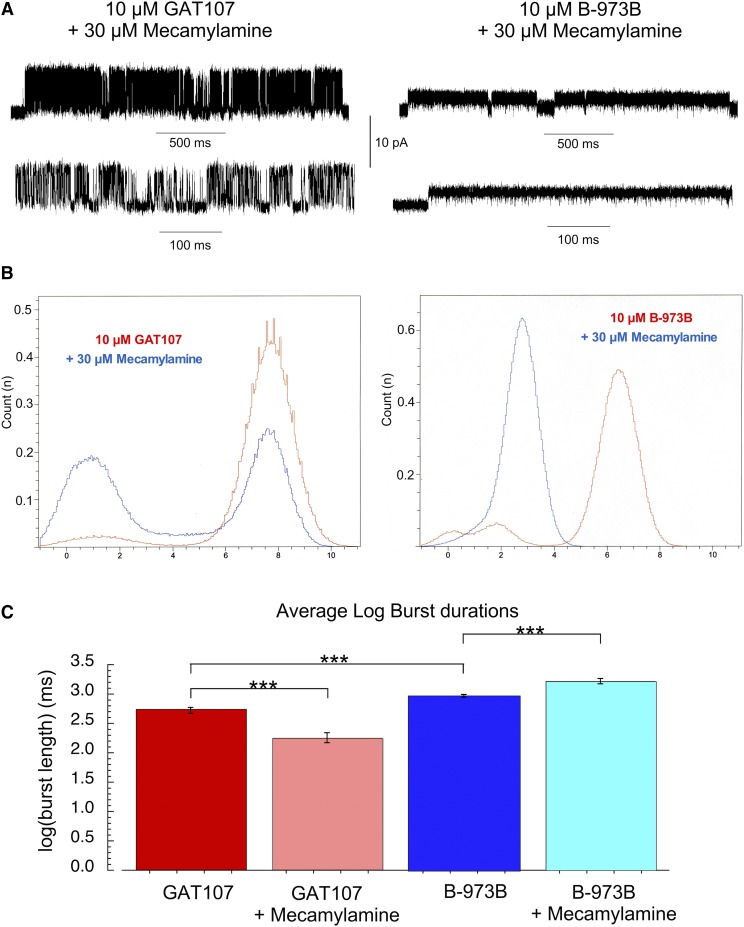
Fig. 8.
(A) Representative α7 single-channel traces of cell-attached patches for GAT107 and B-973B coapplied with 30 µM mecamylamine shown at different time scales as indicated. Currents were sampled at 50 kHz and low-pass filtered at 6 kHz. (B) Representative normalized all points (amplitude) histograms for 1-second intervals of channel-bursting activity in the presence of the ago-PAMs alone (red) or the ago-PAMs plus 30 µM mecamylamine (blue). (C) Since burst-duration distributions are exponential functions and unsuitable for parametric comparisons, burst durations were converted to their corresponding log10 values, generating Gaussian-like distributions. Shown are the average log10 burst durations for the two ago-PAMs ± S.E.M. of those values; t test comparisons indicated significant differences between the values for GAT107 alone compared with B-973B alone, that GAT107 bursts were shorter in mecamylamine, and that B-973B bursts were longer in the presence of mecamylamine. A Bonferroni correction was applied so that P values for a given level of significance are reduce by a factor of 3. The P value for comparison of GAT107 log10 burst durations to the B973B burst durations was 3.6 × 10⁻¹⁰. The P value for the comparison of GAT107 log10 burst durations to the GAT107 burst durations in the presence of mecamylamine was 3.8 × 10⁻⁶. The P value for the comparison of B-973B log10 burst durations to the B-973B burst durations in the presence of mecamylamine was 1.7 × 10⁻⁵, so that all were significant at an adjusted value <0.00033. We also calculated the false discovery rate correction for multiple comparisons, and those corrected values were 1.07 × 10⁻⁹, 5.7 × 10⁻⁵, and 1.7 × 10⁻⁵, respectively, for the values reported above. ***P < 0.0001.

