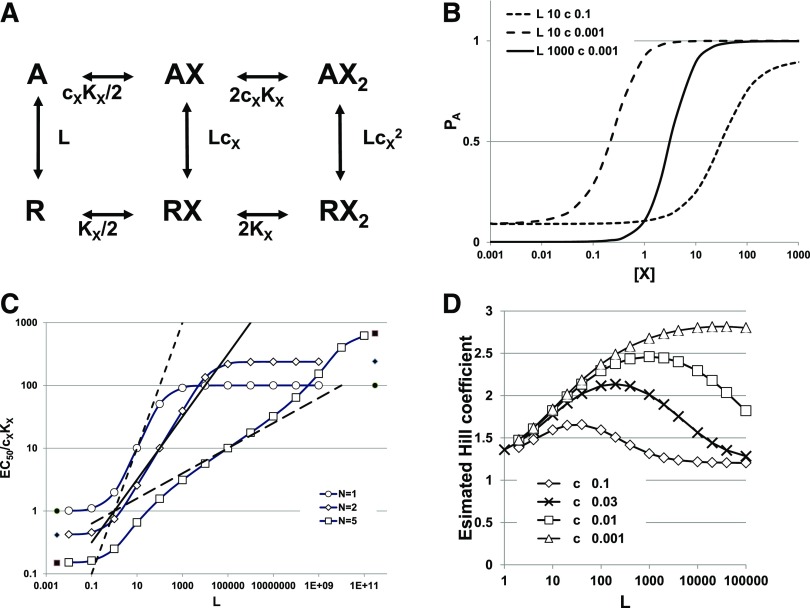
Fig. 1.
Model and predictions for one drug. (A) The state diagram for drug X with two sites acting on a receptor after the MWC concerted transition scheme. Inactive receptor states (R) occupy the line at the bottom, whereas active states (A) occupy the line at the top. In the absence of X, the receptor activates with the inverse of the activation equilibrium given as L = R/A. Agonist X binds to its site with dissociation constant KX,R on the inactive receptor and KX,A on the active receptor, with cX = KX,A/KX,R. In the scheme, KX = KX,R. The equilibrium between R and A states is determined by c, as dictated by detailed mass action in the coupled cycles. (B) Activation curves (PA) as a function of [X] for three combinations of parameters. For all the relationships, NX = 2 and KX = 100 (KX = KX,R). The values for L and cX were varied as shown in the figure legend. (C) A log-log plot of the normalized EC50,X against L for three values of NX with cX = 0.01 and KX,R = 100. The lines show slopes of 1/NX, whereas the filled symbols show the predicted values for the asymptotes. Note that the EC50 value can be less than KX,A (=1 in the normalized plot) or greater than KX,R (=100 in the normalized plot). (Panel modified from Akk et al., 2018). (D) The Hill coefficient plotted against L for different values of cX (0.1, 0.03, 0.01, and 0.001, as indicated) whereas for all plots in the panel NX = 3, KX,R = 100. Estimates were made using eq. 1.16.

