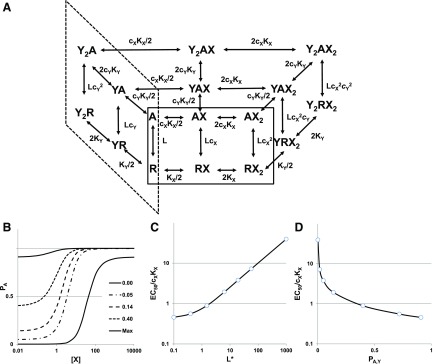
Fig. 2.
The state diagram and concentration-response relationships for two drugs acting at different sites. (A) A partial state diagram for two drugs (X and Y, each with two sites) acting on a receptor. Inactive receptor states (R) occupy the plane at the bottom [note that some states are obscured (e.g., YRX, Y2RX)], while active states (A) occupy the plane at the top. The diagram is distorted to show states with only agonist X bound (solid line box at front) and only agonist Y bound (short dash line box at left); the other states have both agonists bound. In the absence of both X and Y, the receptor activates constitutively with L = R/A. Agonist X binds to its site with dissociation constant KX,R on the resting receptor, and KX,A on the active receptor, with cX = KX,A/KX,R. Agonist Y binds to a different site, with dissociation constant KY,R on the resting receptor and KY,A on the active receptor, with cY = KY,A/KY,R. In the scheme, KX = KX,R and KY = KY,R. Note that the presence of bound Y does not affect the binding of X or vice versa. The equilibrium between R and A states is determined by the respective values for c, as dictated by detailed mass action in the coupled cycles. (Panel modified from Akk et al., 2018). (B) The activation curve for drug X at various concentrations of drug Y. (The numbers indicate the background PA elicited by [Y] present.) (C) shows the decrease in the EC50 value for X as [Y] increases, so L* steadily decreases. (D) shows the same data for the EC50, but now plotted as a function of the increasing background PA elicited by Y. (B–D) L = 1000, NX = 2, KX = 100, cX = 0.01, and NY = 2, KY = 30, cY = 0.01. For (B), the values for [Y] were 0, 2, 4, 10, and saturating, which produced background PA values of 0, 0.05, 0.14, 0.40, and 0.91, respectively, and resulted in L* values of 1000, 19.4, 6.25, 1.51, and 0.10. In (C and D), additional points are plotted for values of [Y] of 1 and 30, producing PA values of 0.02 and 0.72, and L* values of 56.9 and 0.39.

