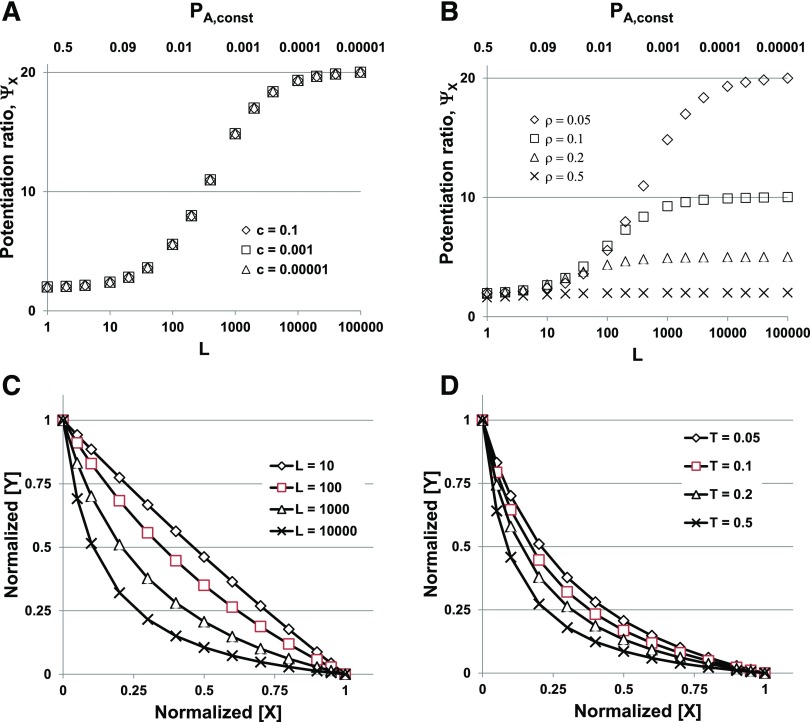
Fig. 3.
Potentiation depends on the level of spontaneous activity and the response amplitude used. (A and B) The potentiation ratio for normalized responses (ΨX, eq. 2.20) is plotted against L (lower abscissa scale), whereas the corresponding constitutive background activity [PA,const = 1/(1 + L)] is shown above the plots. (A) shows that ΨX increases as L becomes larger (PA,min smaller) but does not depend on the affinity ratio (efficacy) for the potentiating drug X (cX between 0.1 and 0.00001). The value for ΨX approaches 2 − ρ as L → 0 and has a plateau at 1/ρ as L increases, then increases to a second plateau at  as L → ∞ (not shown in this plot). (B) shows that ΨX decreases as the value for ρ increases from 5% to 50% of the maximal response to GABA. (C and D) Isobolograms; the concentrations of X and Y are normalized to the concentrations producing the target response in the absence of the other drug (X0 and Y0). This is because the values for X0 and Y0 varied so much in the different conditions that some of the plots could not be resolved when plotted as actual concentrations. As L increases (C) the degree of curvature also increases, which would be interpreted as increasing synergy. As the target response (Τ) increases (D), the curvature also increases. Note that comparing (B and D) appears to provide different qualitative statements regarding the interactions of the two drugs; the potentiation ratio decreases with increasing initial response, whereas the curvature of the isobologram increases with increasing target response. In (A), T = 0.05, KG = 300, NG = 3, and cG = 1/300, whereas KX = 300, NX = 3, and cX = 0.1, 0.001, or 0.00001, as indicated. In (B), KG = 300, NG = 3, and cG = 1/300; and KX = 300, NX = 3, and cX = 0.001, whereas the target response (T) changes from 0.05 to 0.5, as indicated. In (C and D), KX = KY = 300, NX = NY = 3, and cX = cY = 1/300, whereas L and T change as indicated.

