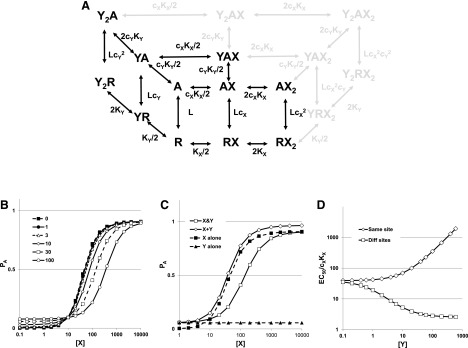
Fig. 4.
The state diagram and concentration-response relationships for two drugs acting at the same sites. (A) The state diagram for drugs X and Y interacting with the same two sites acting on a receptor. Inactive receptor states (R) occupy the plane at the bottom, whereas active states (A) occupy the plane at the top. The inactive state YRX is hidden in the diagram. Note that the scheme shows a restricted set of the states available for the case when X and Y bind to distinct sites (indicated by the gray states and transitions). The parameters have the same definitions as before. (B) The activation curves as a function of [X] in the presence of different concentrations of a lower-efficacy drug Y (indicated in the panel). (C) Activation curves at a single [Y] ([Y] = 30) for [X] in the absence of [Y] (X alone, filled squares), [Y] (Y alone, filled triangles), the sum of the response to X alone and [Y] alone (X + Y, hollow diamonds) and the response to X applied in the presence of [Y] (X & Y, hollow squares). (D) The effect of increasing [Y] on the EC50 for X, if X and Y act at the same sites (diamonds) or different sites (squares). For (B and C): L = 1000, N = 2, KX = 100, cX = 0.01, and KY = 10, cY = 0.1. In (B), [Y] ranged from 0 to 100, as indicated, whereas in (C) [Y] = 30. In (D), for the “same site” calculations L = 1000, N = 2, KX = 100, cX = 0.01, and KY = 10, cY = 0.1, whereas for the “different site” L = 1000, NX = 2, KX = 100, cX = 0.01, and NY = 2, KY = 10, cY = 0.1.

