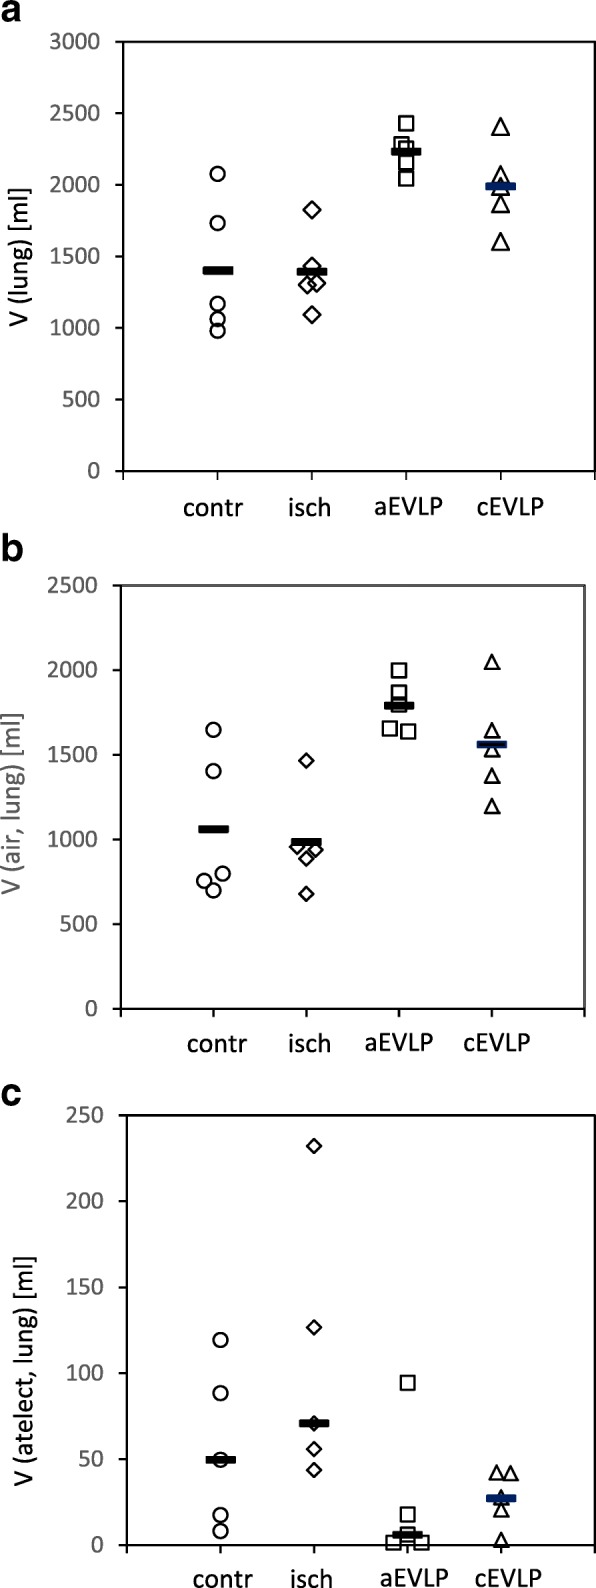
Fig. 1.

Stereological estimation of lung volume (a), volume of pulmonary air content (b) and volume of atelectatic lung parenchyma (c). Data points depict individual animals, bars indicate group means (a and b) or medians (c). Group differences were statistically significant for: (a) aEVLP and cEVLP vs. control group (p = 0.004 and p = 0.047, respectively) and aEVLP and cEVLP vs. ischaemia group (p = 0.004 and p = 0.042, respectively); (b) aEVLP vs. control group (p = 0.010) and aEVLP and cEVLP vs. ischaemia group (p = 0.005 and p = 0.049, respectively); (c) aEVLP and cEVLP vs. ischaemia group (both p = 0.048). V volume, atelect atelectatic lung parenchyma, contr control group, isch ischaemia group, aEVLP acellular EVLP group, cEVLP cellular EVLP group.
