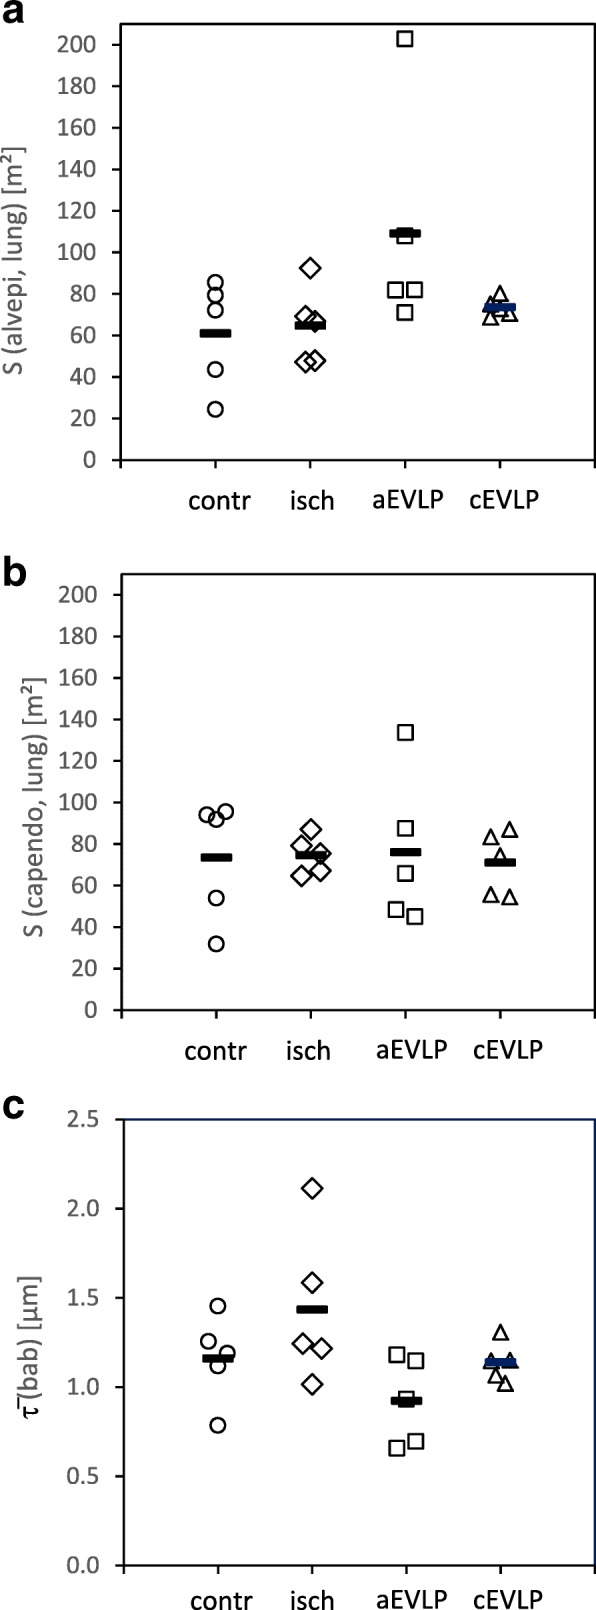
Fig. 6.

Stereological estimation of alveolar epithelial surface (a), endothelial surface (b) and blood-air barrier thickness (bab) (c). Group differences were not statistically significant (alveolar epithelial surface p = 0.103; endothelial surface p = 0.990; bab thickness p = 0.075). Data points depict individual animals, bars indicate group means, S surface area, (bab) arithmetic mean thickness of blood air barrier, contr control group, isch ischaemia group, aEVLP acellular EVLP group, cEVLP cellular EVLP group
