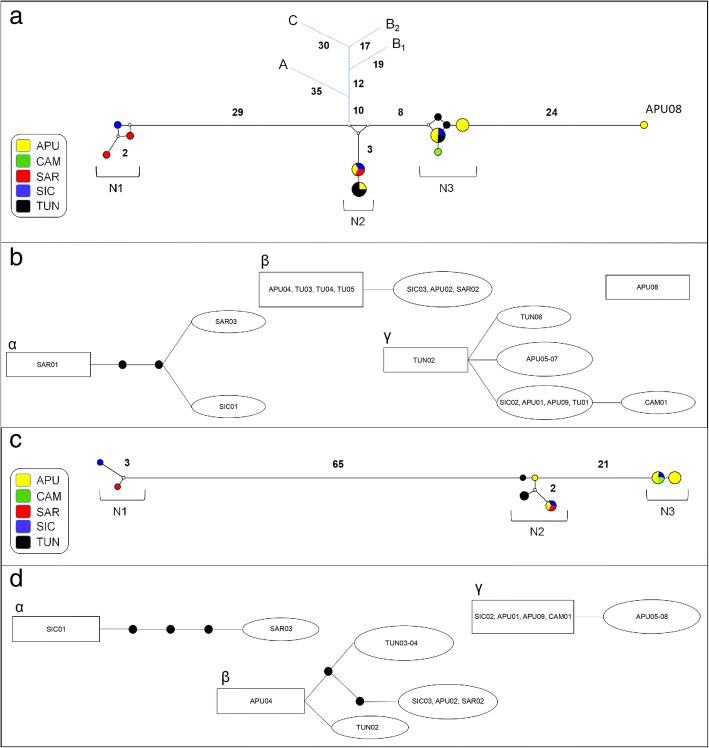
Fig. 2.
Network analysis. a, b cox1 dataset; c, d nad1 dataset. a, c Median-joining networks with haplotypes coloured according to their geographical distribution. Small white dots on the nodes show median vectors representing hypothetical connecting sequences, calculated with a maximum parsimony method. The numbers of mutations between haplotypes greater than one are reported on the network branches. In the median-joining networks based on cox1 dataset (a) the short blue branches represent the connection with the other species. Abbreviations: A, Mesocestoides litteratus; B1 and B2, M. lineatus from Mongolia and Slovak Republic, respectively; C, M. corti. b, d Clusters retrieved using 95% statistical parsimony networks. The number of mutations greater than one are shown as black dots on the network branches. The haplotype in a square has the largest outgroup weight. Abbreviations: APU, Apulia; CAM, Campania; SAR, Sardinia; SIC, Sicily; TUN, Tunisia

