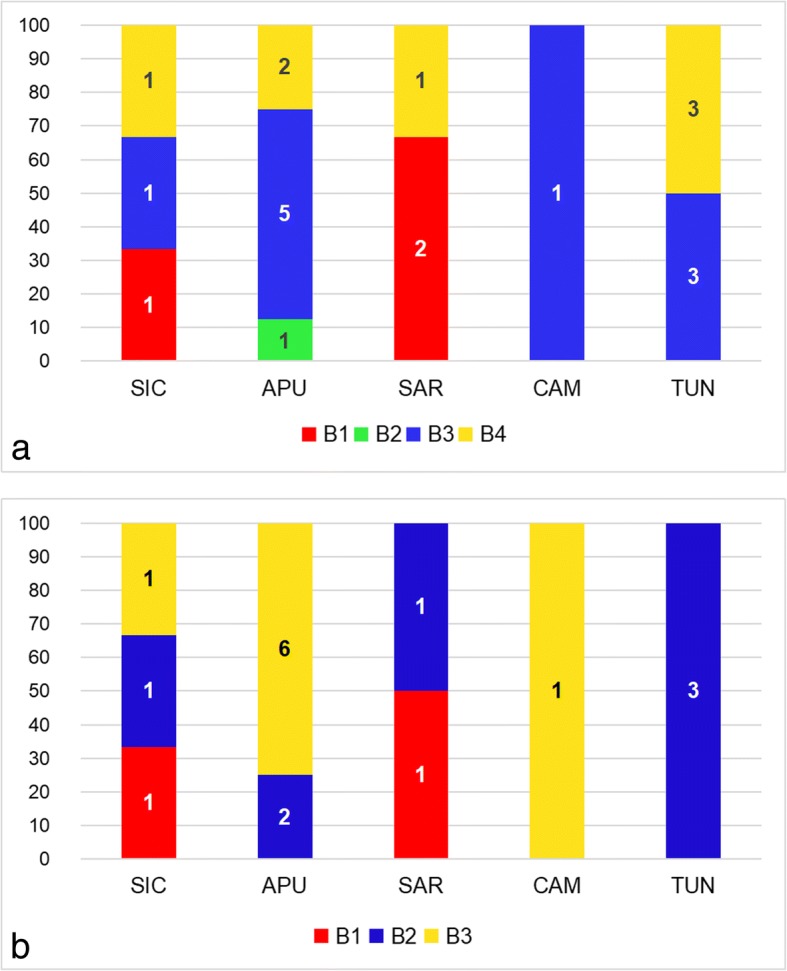
Fig. 3.

Distribution of the groups identified by Bayesian model-based clustering implemented in Baps 6 within populations. a cox1 dataset. b nad1 dataset. X axis: populations; Y axis: relative frequency of distribution (%). Abbreviations: APU, Apulia; CAM, Campania; SAR, Sardinia; SIC, Sicily; TUN, Tunisia. The numbers in bars indicate the absolute frequency of distribution. B1, B2, B3 and B4 indicate the groups identified by Bayesian model-based clustering described in the text
